US30 Analysis – June 3
US30 reveals increasing buying pressure within a bullish continuation setup. The daily MACD indicator shows sustained upward momentum, with the MACD line positioned above the signal line. However, the recent flattening of both lines suggests a potential pause or sideways consolidation before another significant move. Although the histogram indicates a reduction in bullish strength, there is currently no sign of a bearish reversal. Meanwhile, the price continues to trade above the 9-day Simple Moving Average, which is climbing near $42,100—reinforcing a short-term bullish outlook.
US30 Key Levels
Resistance Levels: $41,740, $42,880, $45,100
Support Levels: $38,400, $36,500, $35,710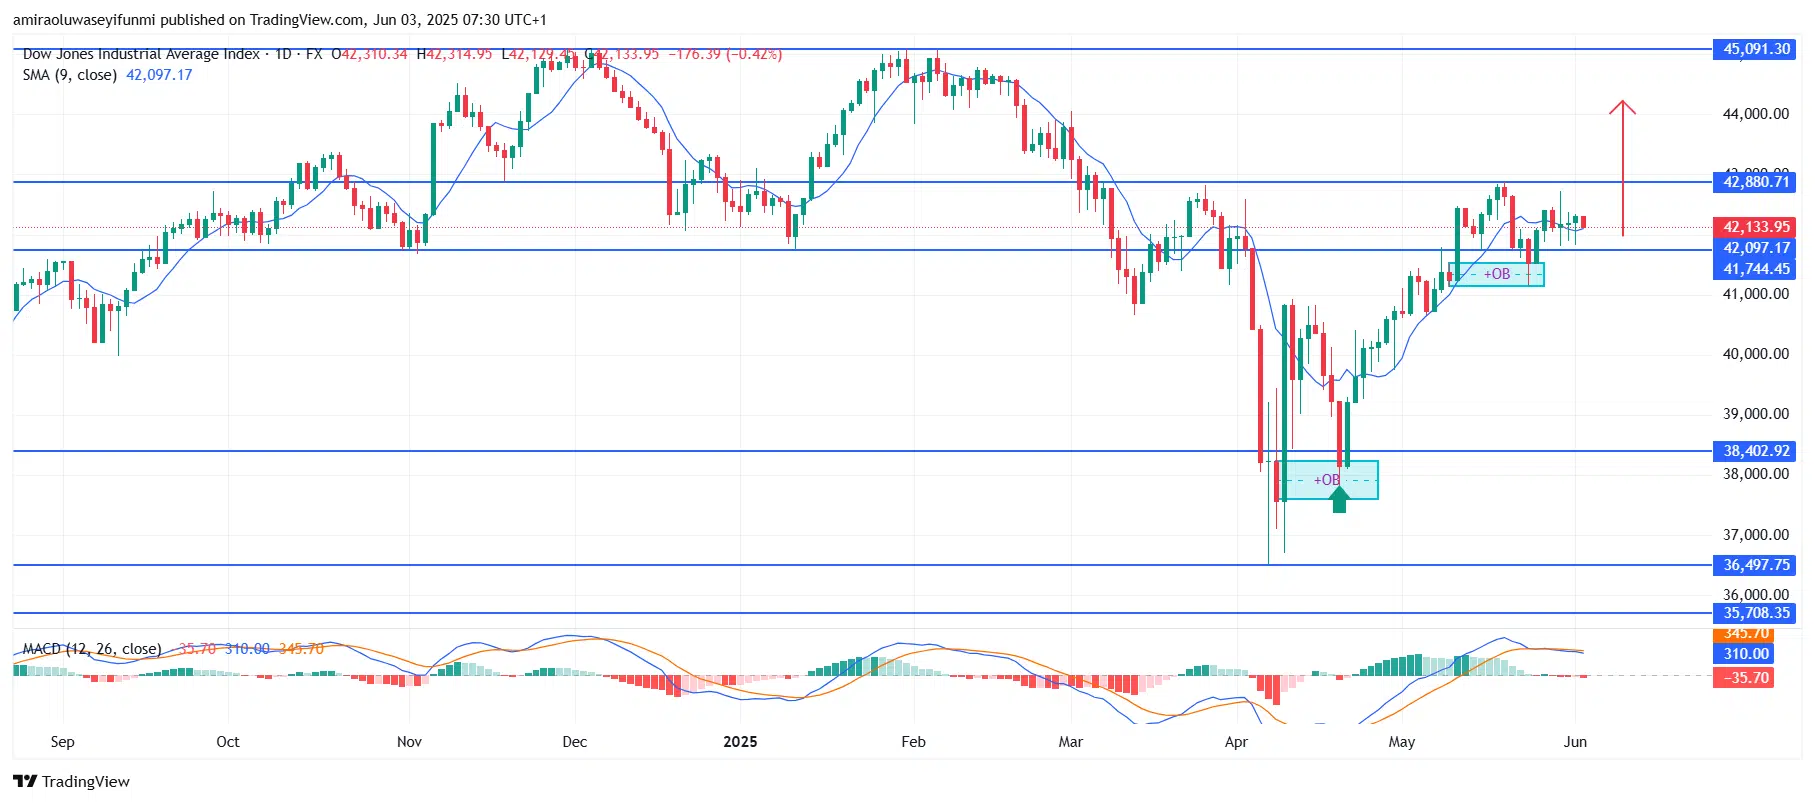
US30 Long-Term Trend: Bullish
The US30 (Dow Jones Industrial Average) recently bounced from a significant order block near $38,400 and has since formed a higher low around $41,740. This level now serves as a launchpad for further price gains. Since the recovery in April, price action has maintained a consistent fractal pattern, with a short-term resistance zone near $42,880. Candlestick behavior in this area indicates buyer dominance over sell-side liquidity, highlighting strong underlying demand.
Considering the current technical setup, the outlook for US30 remains bullish. A confirmed breakout and close above the $42,880 resistance could trigger a further rally toward the key psychological level of $45,100, which aligns with previous historical highs. This bullish scenario is further validated by the MACD’s positive divergence and recent support around the $41,740 order block. However, failure to sustain levels above $42,000 could lead to temporary volatility before the broader uptrend resumes. Traders seeking quality forex signals may find this setup particularly valuable.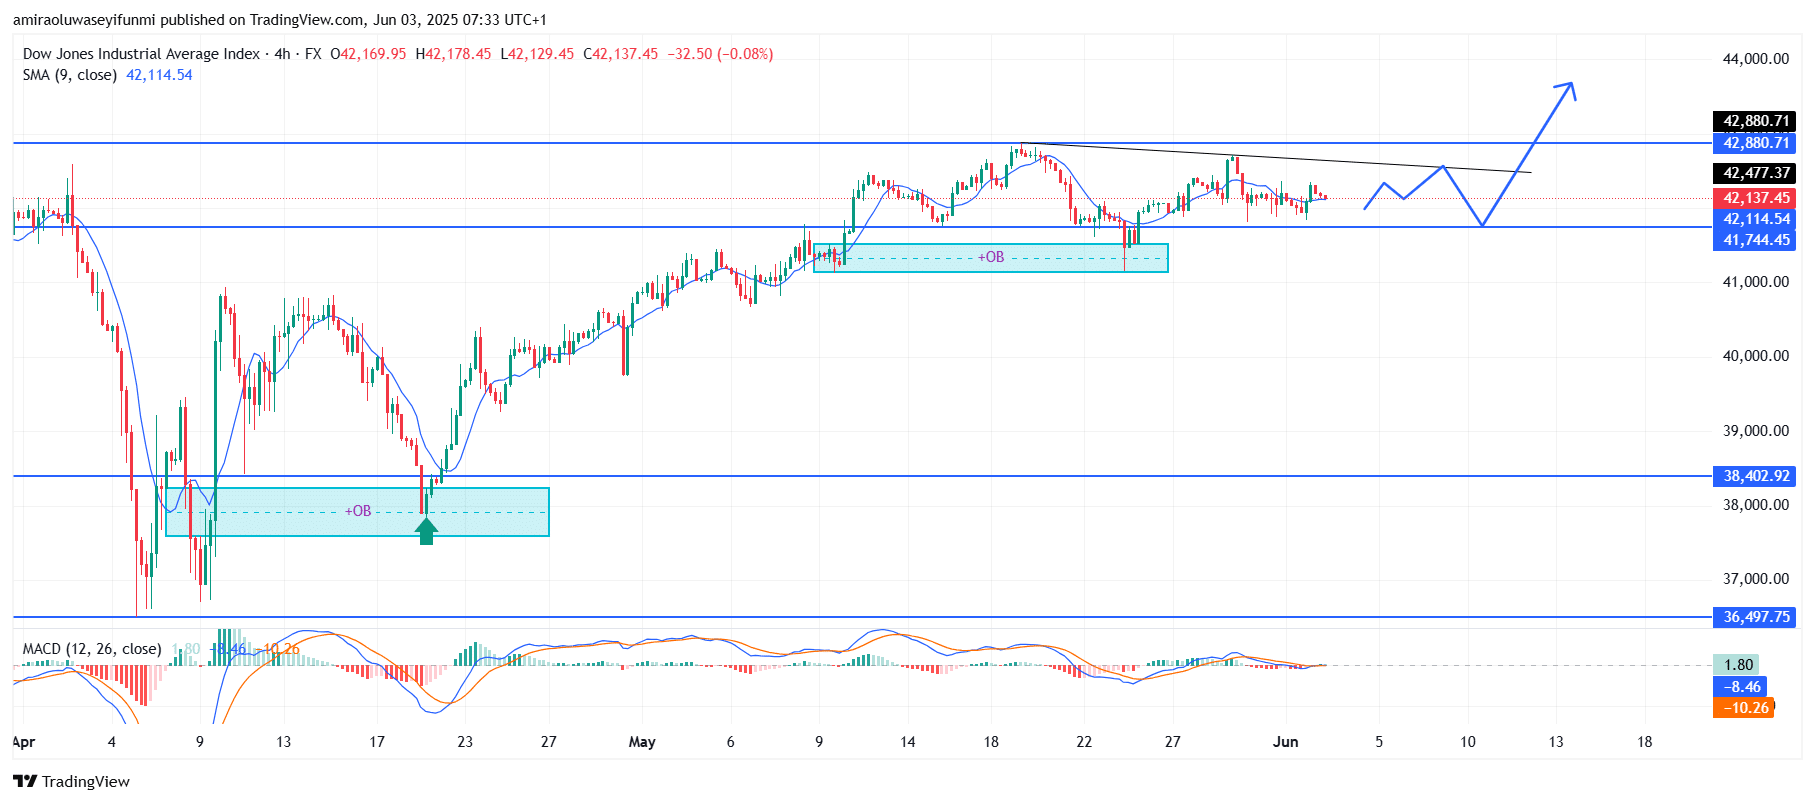
US30 Short-Term Trend: Bullish
US30 maintains a bullish outlook on the four-hour chart, bolstered by a strong bounce from the $41,750 order block. The price is currently consolidating just below the $42,880 resistance level, forming a potential ascending triangle pattern.
The 9-period SMA around $42,110 continues to act as dynamic support, indicating ongoing buying interest. MACD is gradually turning upward, signaling a potential bullish breakout toward the $44,000 region.
Make money without lifting your fingers: Start using a world-class auto trading solution
How To Buy Lucky Block – Guide, Tips & Insights | Learn 2 Trade
Note: Learn2.trade is not a financial advisor. Do your research before investing your funds in any financial asset, product, or event. We are not responsible for your investment results.
- Broker
- Min Deposit
- Score
- Visit Broker

- Award-winning Cryptocurrency trading platform
- $100 minimum deposit,
- FCA & Cysec regulated

- 20% welcome bonus of upto $10,000
- Minimum deposit $100
- Verify your account before the bonus is credited
- Fund Moneta Markets account with a minimum of $250
- Opt in using the form to claim your 50% deposit bonus
Learn to Trade
Never Miss A Trade Again

Signal Notification
Real-time signal notifications whenever a signal is opened, closes or Updated

Get Alerts
Immediate alerts to your email and mobile phone.

Entry Price Levels
Entry price level for every signal Just choose one of our Top Brokers in the list above to get all this free.