US30 Analysis – February 18
US30 is currently in a retracement phase with potential bullish continuation after correction. The MACD (Moving Average Convergence Divergence) indicator shows weakening bullish momentum as the histogram declines and the signal lines begin to converge. This hints at a possible shift in direction. The 9-day SMA at $44,570 is currently acting as a dynamic resistance, and price movement below it suggests that sellers are gaining short-term control. If the MACD crosses downward, further bearish pressure could drive the index lower before a potential reversal.
US30 Key Levels
Resistance Levels: $45100, $47000, $48000
Support Levels: $43500, $41700, $40000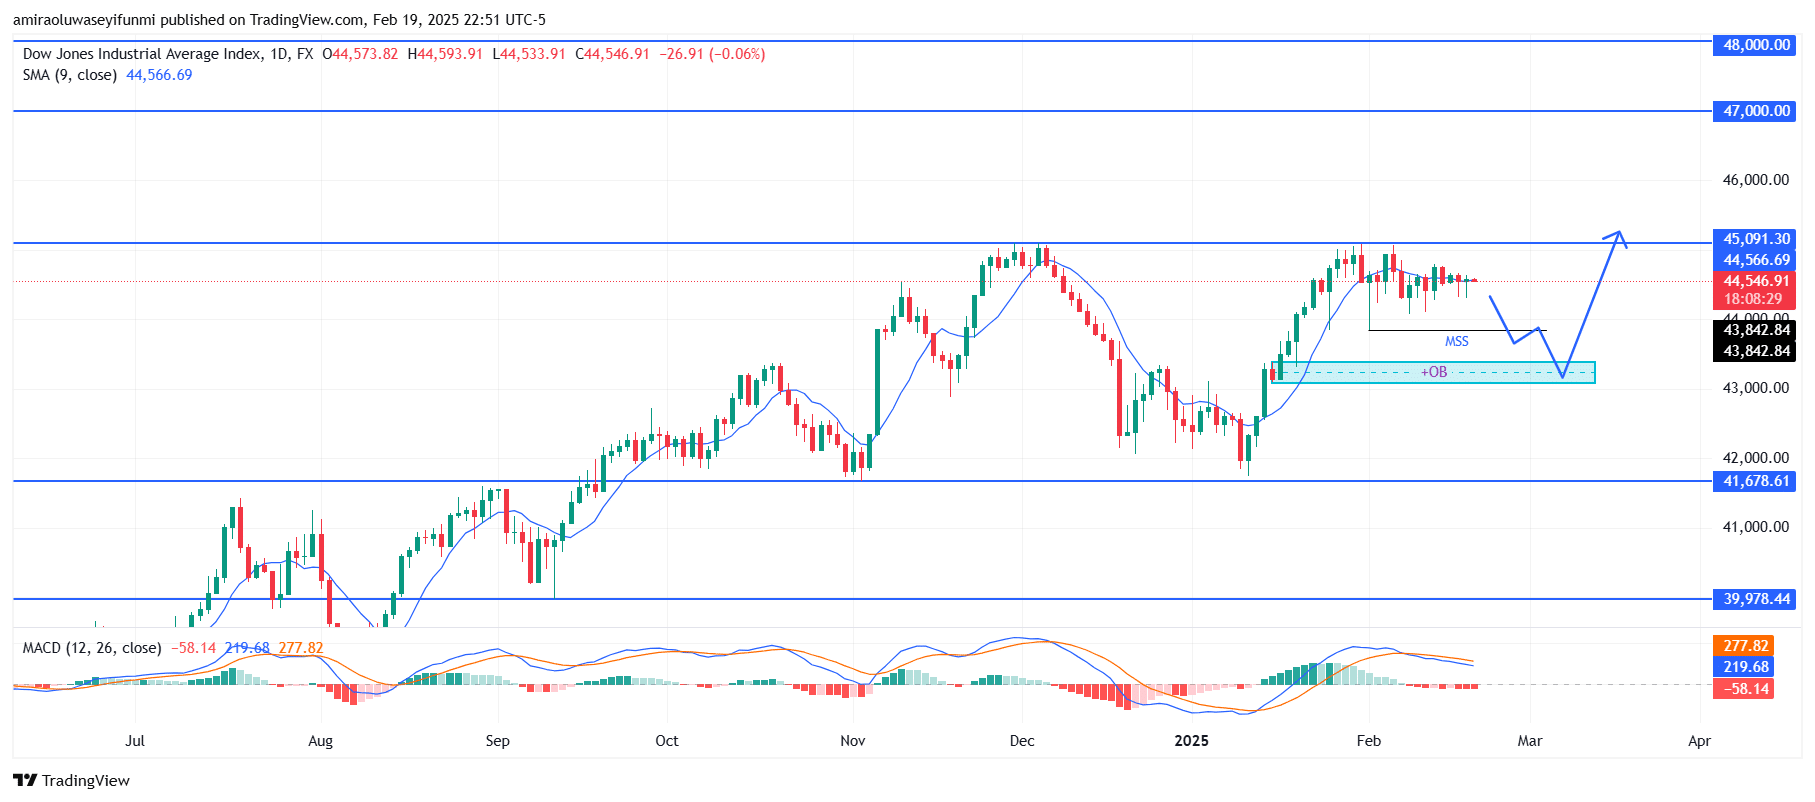
US30 Long-Term Trend: Bullish
Price action indicates that US30 is struggling to break above the $45,100 resistance level, leading to consolidation and a possible bearish breakdown. A market structure shift (MSS) is visible, reinforcing the likelihood of a retracement towards the order block (OB) region around $43,500. If this support fails to hold, the next major demand zone lies near $41,700, which could act as a strong reversal point.
Given the overall trend, a corrective dip into the bullish order block is expected before a bullish resurgence. Buyers will likely step in at the OB level, targeting a recovery back towards $45,100 and potentially higher towards the $47,000–$48,000 range. However, if bearish pressure intensifies and breaks below the bullish order block, the outlook may shift to a deeper correction.
US30 Short-Term Trend: Bearish
The US30 four-hour chart shows a bearish market structure shift (MSS), with price rejecting the descending trendline and struggling to break above $44,750. The 9-period SMA at $44,530 is acting as dynamic resistance, reinforcing downward pressure.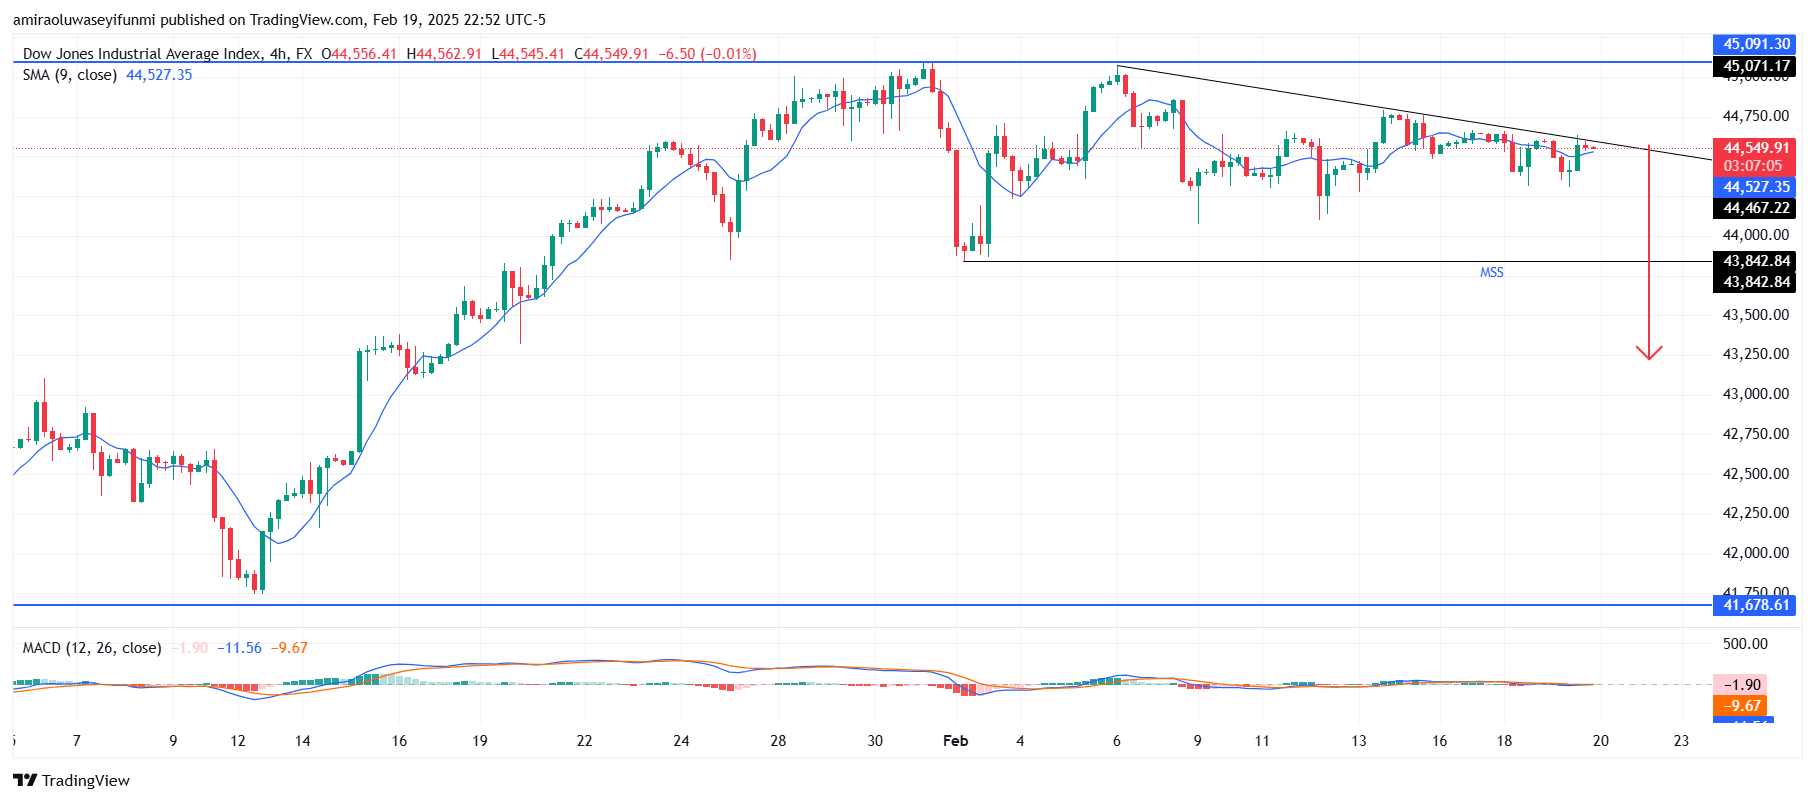
Make money without lifting your fingers: Start using a world-class auto trading solution
How To Buy Lucky Block – Guide, Tips & Insights | Learn 2 Trade
Note: Learn2.trade is not a financial advisor. Do your research before investing your funds in any financial asset, product, or event. We are not responsible for your investment results.
- Broker
- Min Deposit
- Score
- Visit Broker

- Award-winning Cryptocurrency trading platform
- $100 minimum deposit,
- FCA & Cysec regulated

- 20% welcome bonus of upto $10,000
- Minimum deposit $100
- Verify your account before the bonus is credited
- Fund Moneta Markets account with a minimum of $250
- Opt in using the form to claim your 50% deposit bonus
Learn to Trade
Never Miss A Trade Again

Signal Notification
Real-time signal notifications whenever a signal is opened, closes or Updated

Get Alerts
Immediate alerts to your email and mobile phone.

Entry Price Levels
Entry price level for every signal Just choose one of our Top Brokers in the list above to get all this free.