

US30 Analysis – March 18
US30 crashes with potential short-term pullback signals. The US30 chart reflects a bearish sentiment, supported by key technical indicators. The 9-day Simple Moving Average (SMA) is positioned around $41,770, serving as dynamic resistance. Price remains below this level, confirming continued downward momentum. The Relative Strength Index (RSI) is approximately 38, suggesting oversold conditions, though not yet indicating a strong reversal. If RSI stays below 40, the bearish trend is likely to continue with limited bullish activity.
US30 Key Levels
Resistance Levels: $43,000, $45,100, $47,000
Support Levels: $41,680, $39,980, $38,400
US30 Long-Term Trend: Bearish
The price action confirms a downward trend, marked by recent lower highs and lower lows. The current price hovers around $41,750, struggling to break above the $41,770 SMA level. A slight bullish retracement is underway, with key Fibonacci retracement zones near $42,350 and $42,760 acting as resistance. Strong support is found around $40,660, and a break below this level could increase selling pressure, driving the index toward $39,980 and $38,400.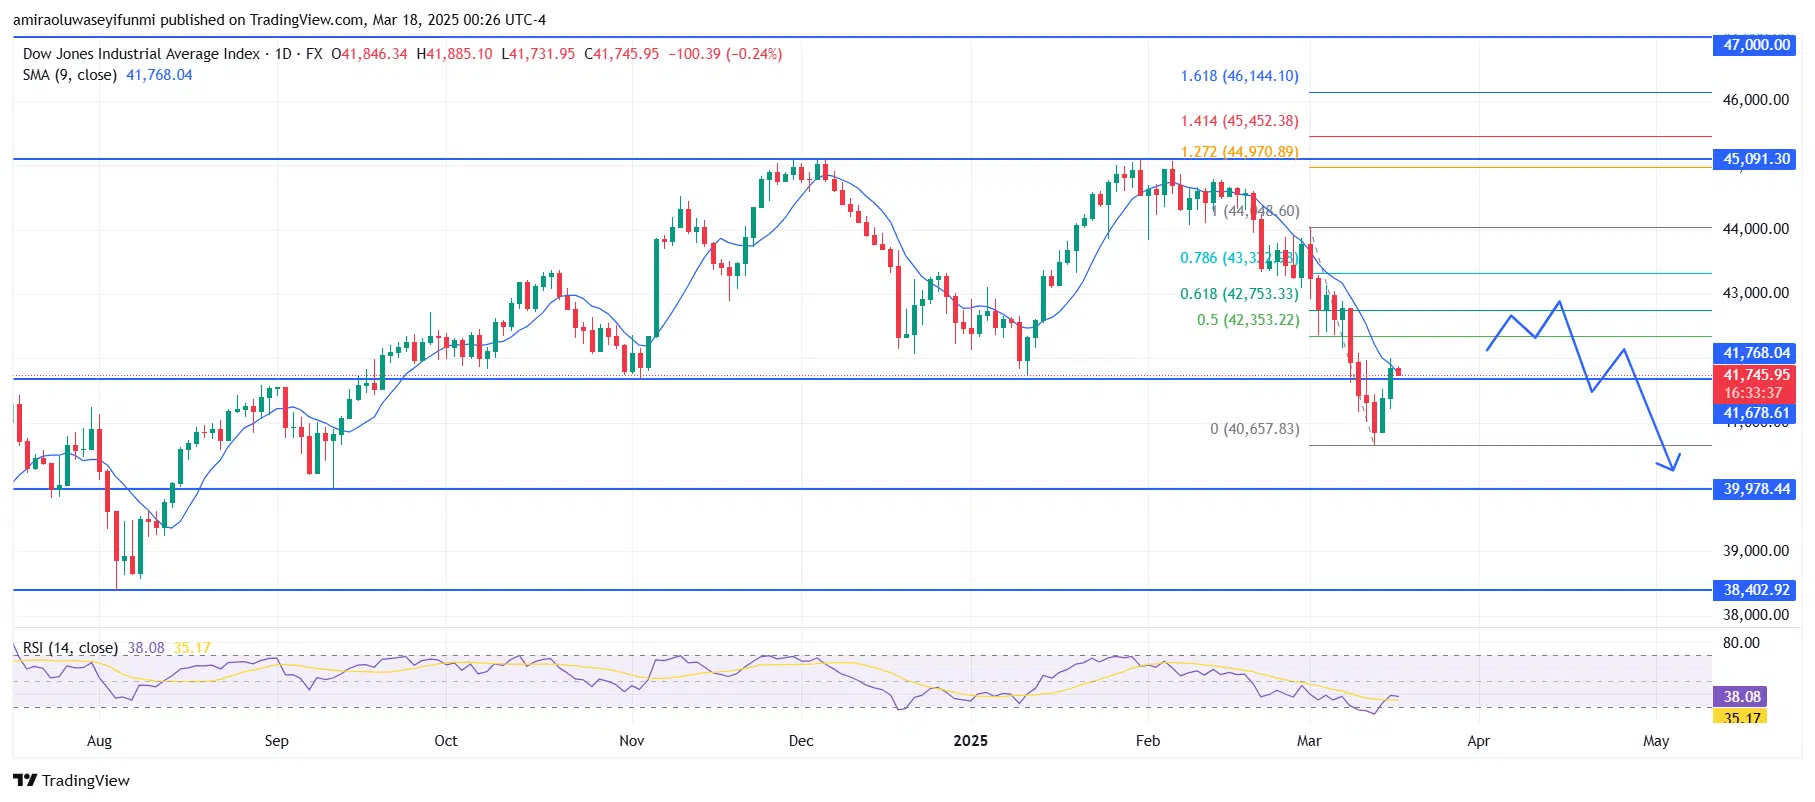
US30 Short-Term Trend: Bearish
US30 is currently undergoing a bullish retracement on the four-hour chart, approaching the $42,800 supply zone. The 9-day SMA near $41,570 offers short-term support, but the broader trend remains bearish.
Make money without lifting your fingers: Start using a world-class auto trading solution
How To Buy Lucky Block – Guide, Tips & Insights | Learn 2 Trade
Note: Learn2.trade is not a financial advisor. Do your research before investing your funds in any financial asset, product, or event. We are not responsible for your investment results.
- Broker
- Min Deposit
- Score
- Visit Broker

- Award-winning Cryptocurrency trading platform
- $100 minimum deposit,
- FCA & Cysec regulated

- 20% welcome bonus of upto $10,000
- Minimum deposit $100
- Verify your account before the bonus is credited


- Fund Moneta Markets account with a minimum of $250
- Opt in using the form to claim your 50% deposit bonus


