Key Resistance Zones: 35000, 35500, 36000
Key Support Zones: 27000, 26500, 26000
US Wall Street 30 (US30USD) Long-term Trend: Bearish
US30USD is in an upward move. The index has earlier fallen to the low of level 34273 as bulls bought the dips. In the previous trend, the market reached the high of level 35086. Buyers could not sustain the bullish momentum. Meanwhile, on the September 27 uptrend, a retraced candle body tested the 50% Fibonacci retracement level. The retracement indicates that US30USD will rise to level 2.0 Fibonacci extension or level 36363.80.
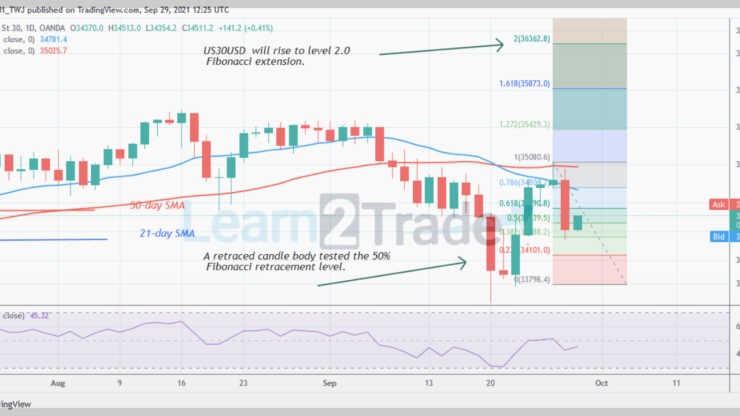
US Wall Street 30 Daily Chart Indicators Reading:
US Wall Street 30 is at level 42 of the Relative Strength Index period 14. It indicates that it is in the bearish trend zone and below centerline 50. The 21-day and 50 –day SMAs are sloping downward indicating the downtrend.
US Wall Street 30 (US30USD) Medium-term Trend: Bearish
On the 4-hour chart, the index price is in a downward move. The market declined to the low of level 34278.20 as price reached the oversold region. The index is hovering above level 34278 for a possible rise. Meanwhile, on September 27 uptrend; a retraced candle body tested the 38.2% Fibonacci retracement level. The retracement indicates that US30USD will rise to level 2.618 Fibonacci extension or level 37155.20.
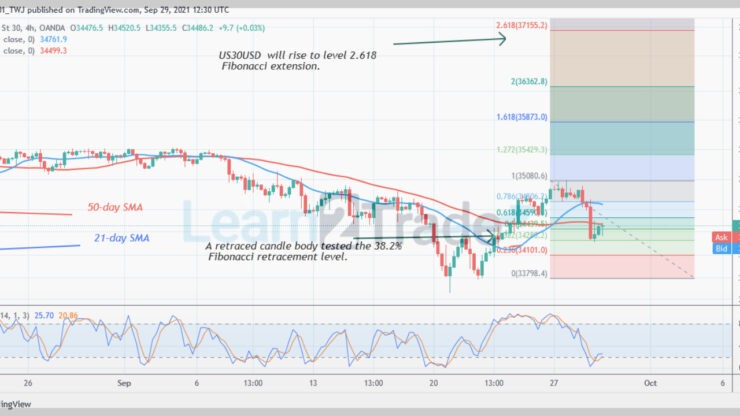
4-hour Chart Indicators Reading
US30USD is above the 25% range of the daily stochastic. This implies that the market is in a bullish momentum. The 21-day and 50-day SMAs are sloping upward indicating the uptrend.
General Outlook for US Wall Street 30 (US30USD)
US Wall Street 30 is in an upward move. On the 4-hour chart, the index has a bullish crossover. That is, the 21-day SMA crosses above 50-day SMA suggesting a buy signal.
You can purchase crypto coins here: Buy Tokens
Note: Learn2Trade is not a financial advisor. Do your research before investing your funds in any financial asset or presented product or event. We are not responsible for your investing results
- Broker
- Min Deposit
- Score
- Visit Broker

- Award-winning Cryptocurrency trading platform
- $100 minimum deposit,
- FCA & Cysec regulated

- 20% welcome bonus of upto $10,000
- Minimum deposit $100
- Verify your account before the bonus is credited
- Fund Moneta Markets account with a minimum of $250
- Opt in using the form to claim your 50% deposit bonus
Learn to Trade
Never Miss A Trade Again

Signal Notification
Real-time signal notifications whenever a signal is opened, closes or Updated

Get Alerts
Immediate alerts to your email and mobile phone.

Entry Price Levels
Entry price level for every signal Just choose one of our Top Brokers in the list above to get all this free.