Key Resistance Zones: 28500, 29000, 29500
Key Support Zones: 26000, 25500, 25000
US Wall Street 30 (US30USD) Long-term Trends: Bullish
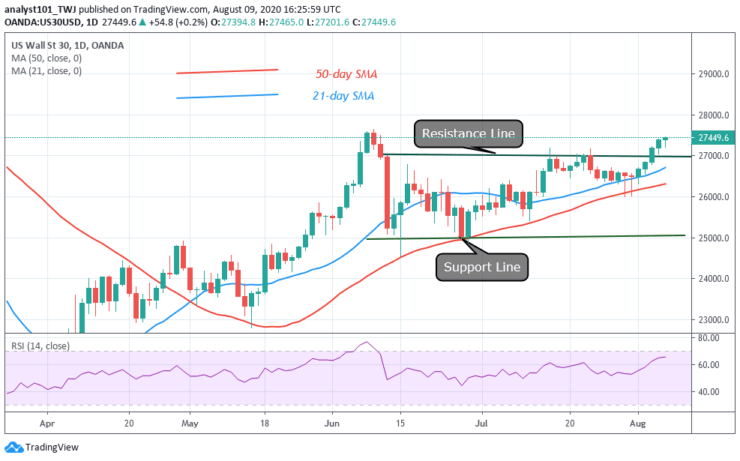
The index was fluctuating between levels 25000 and 27000 since June 10. However, the sideways move has been broken as price breaks the resistance line. It indicates that the market will rise. The price is likely to reach level 28000.
Daily Chart Indicators Reading:
The 21-day and the 50-day SMA are sloping sideways. The price has risen to level 65 of the RSI period 14. The market is in an uptrend zone and it is above the centerline 50.
US Wall Street 30 (US30USD) Medium-term Trend: Bullish
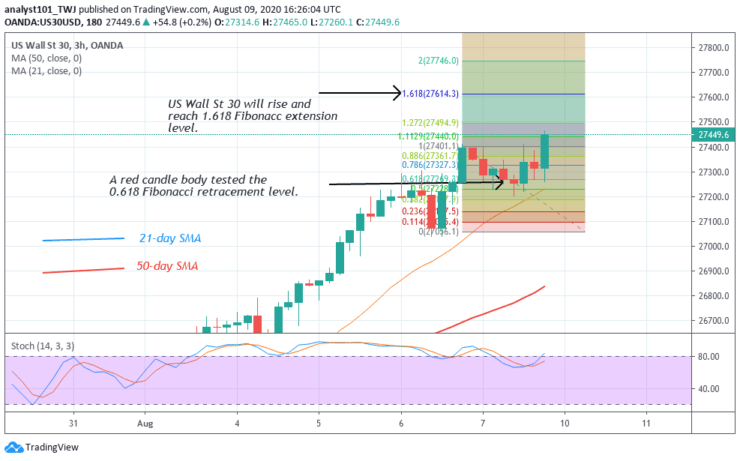
On the 4-hour chart, the index has resumed an upward move. In the August 6 uptrend, a red candle body tested the 0.618 Fibonacci retracement level. This candle body explains that the market will rise and reach level 1.618 Fibonacci extension level. In other words, price reach level 27600.
4-hour Chart Indicators Reading
US30USD is above 75 % range of the daily stochastic. This indicates that the market is in a bullish momentum. The SMAs are sloping upward indicating the uptrend.
General Outlook for US Wall Street 30 (US30USD)
US30USD index is now trending as price breaks the resistance line. According to the Fibonacci tool, the market will reach a high of 27600. At that level, a further upward move will unfold.
Note: Learn2Trade.com is not a financial advisor. Do your research before investing your funds in any financial asset or presented product or event. We are not responsible for your investing results
- Broker
- Min Deposit
- Score
- Visit Broker

- Award-winning Cryptocurrency trading platform
- $100 minimum deposit,
- FCA & Cysec regulated

- 20% welcome bonus of upto $10,000
- Minimum deposit $100
- Verify your account before the bonus is credited
- Fund Moneta Markets account with a minimum of $250
- Opt in using the form to claim your 50% deposit bonus
Learn to Trade
Never Miss A Trade Again

Signal Notification
Real-time signal notifications whenever a signal is opened, closes or Updated

Get Alerts
Immediate alerts to your email and mobile phone.

Entry Price Levels
Entry price level for every signal Just choose one of our Top Brokers in the list above to get all this free.