Key Resistance Zones: 35000, 35500, 36000
Key Support Zones: 27000, 26500, 26000
US Wall Street 30 (US30USD) Long-term Trend: Bullish
US30USD is in an uptrend as it breaks above level 35000 high .The index has reached the high of level 35000. Further upward of the cryptocurrency is likely as the price bars are above the moving averages. Meanwhile, on March 22 uptrend; a retraced candle body tested the 61.8% Fibonacci retracement level. The retracement indicates that the index will rise to level 1.618 Fibonacci extension or level 36084.20. From the price action, the market has reached the high of level 35014.40.
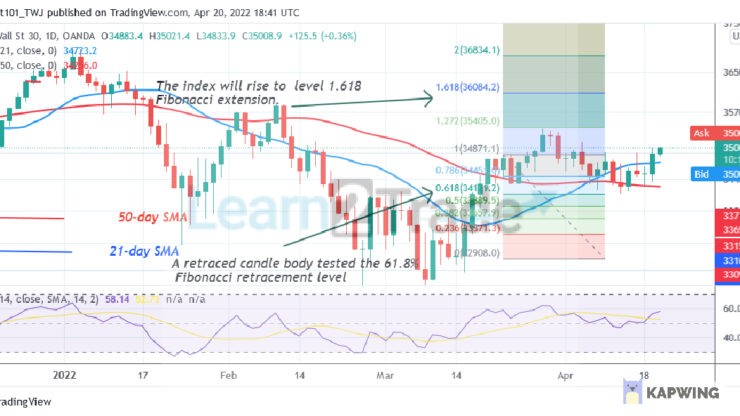
US Wall Street 30 Daily Chart Indicators Reading:
US30USD has fallen to level 58 of the Relative Strength Index for period 14. The index is now in the bullish trend zone and it is capable of a further upward move. US30USD has a bullish crossover. The 21-day SMA crosses above the 50-day line SMA indicating the buy order. The 21-day SMA and the 50-day SMA are sloping upward indicating an uptrend.
US Wall Street 30 (US30USD) Medium-term Trend: Bullish
On the 4-hour chart, US30USD is in an uptrend as price breaks above the moving averages. The index has resumed its upward move but the market reached the overbought region. Meanwhile, on April 17 uptrend; a retraced candle body tested the 78.6% Fibonacci retracement level. The retracement indicates that the index will rise to level 1.272 Fibonacci extension or level 35169.0.
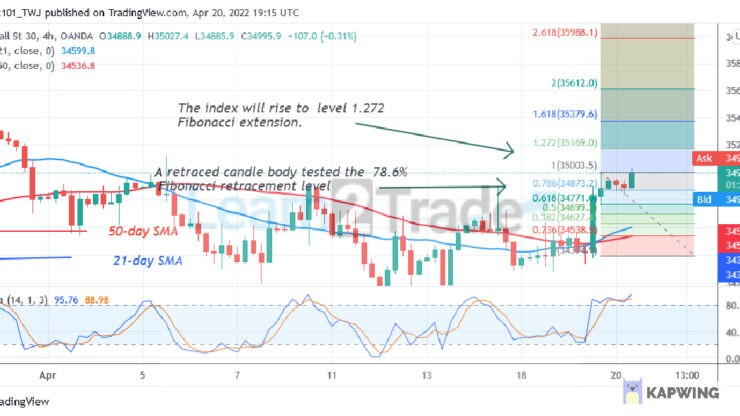
4-hour Chart Indicators Reading
US30USD is above the 80% range of the daily stochastic. The market has reached the overbought region. The current uptrend is likely to face rejection as sellers emerge in the overbought region. The 21-day SMA and the 50-day SMA are sloping upward indicating the downtrend.
General Outlook for US Wall Street 30 (US30USD)
US Wall Street 30 has regained bullish momentum as it breaks above level 35000 high. The index has broken the resistance at level 35000 as it approaches the next resistance at level 35400.
You can purchase crypto coins here: Buy LBlock
Note: Learn2Trade is not a financial advisor. Do your research before investing your funds in any financial asset or presented product or event. We are not responsible for your investing results
- Broker
- Min Deposit
- Score
- Visit Broker

- Award-winning Cryptocurrency trading platform
- $100 minimum deposit,
- FCA & Cysec regulated

- 20% welcome bonus of upto $10,000
- Minimum deposit $100
- Verify your account before the bonus is credited
- Fund Moneta Markets account with a minimum of $250
- Opt in using the form to claim your 50% deposit bonus
Learn to Trade
Never Miss A Trade Again

Signal Notification
Real-time signal notifications whenever a signal is opened, closes or Updated

Get Alerts
Immediate alerts to your email and mobile phone.

Entry Price Levels
Entry price level for every signal Just choose one of our Top Brokers in the list above to get all this free.