

Market Analysis – December 24
The US 30 index has broken below its previous significant higher swing low on the daily chart, signaling a potential shift in market direction. This downturn has resulted in a 6.53% loss since reaching the swing high of 45,050.0.
Key Levels for US 30
Demand Levels: 42,357.0, 40,915.0, 39,525.0
Resistance Levels: 45,056.0, 46,000.0, 47,000.0
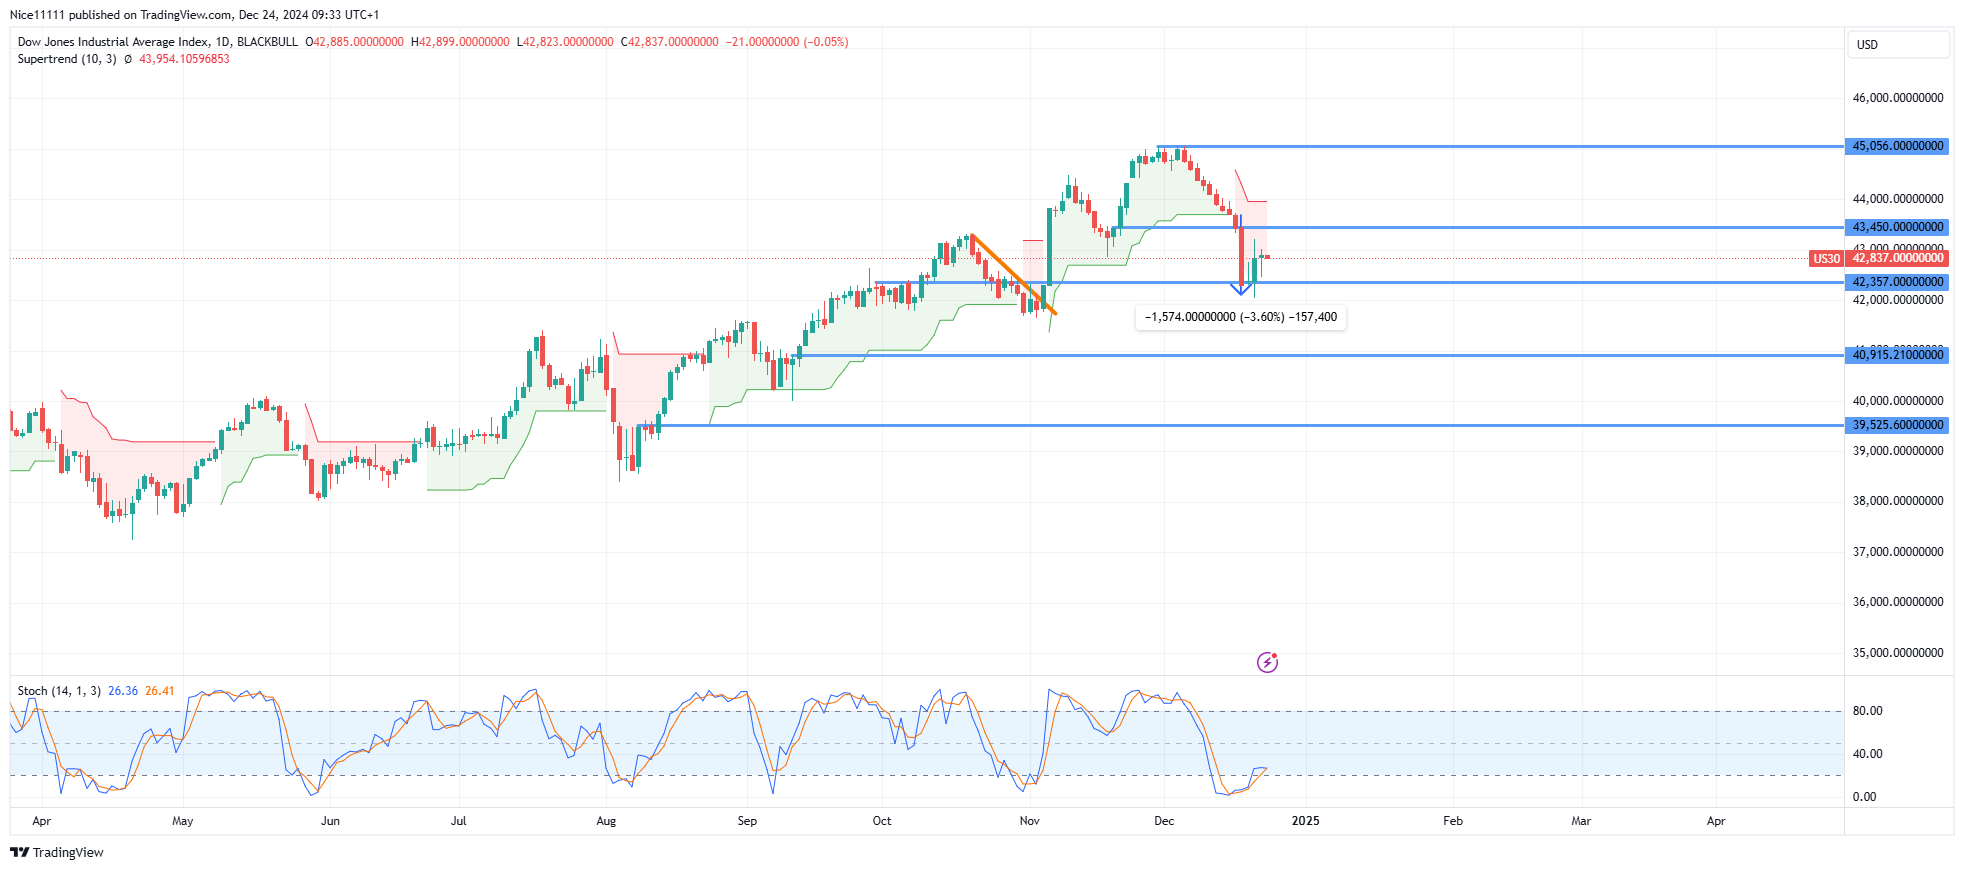 US 30 Long-Term Trend: Bullish
On the daily chart, the US 30 exhibited sideways price action with small-bodied candles from late November into December, indicating fading bullish momentum. This period of consolidation was followed by consecutive bearish candles driving the price toward the key support at 42,357.0.
A sharp decline on December 18 led to a notable 3.6% loss in a single day, reflecting significant bearish pressure. The price action halted at the 42,357.0 support level, which aligns with an unmitigated bullish order block.
Currently, the Stochastic oscillator signals oversold conditions at this level, prompting the emergence of bullish candles after several days of bearish dominance. Forex signals have highlighted this key support zone as a critical area for traders to monitor potential bullish reversals.
US 30 Short-Term Trend: Bearish
Make money without lifting your fingers: Start using a world-class auto trading solution
How To Buy Lucky Block
Note: Learn2.trade is not a financial advisor. Do your research before investing your funds in any financial asset, product, or event. We are not responsible for your investment results.


