Market Analysis – April 30
Nasdaq 100 has repeated a correction and impulse circle on the 24-hour chart. The market has just experienced a bullish displacement after a correction that was initiated in April.
US 100 Significant Levels
Support Levels: 12795.0, 12071.0, 11311.0
Resistance Levels: 13638.0, 13800.0, 140000.0

NAS 100 Long-Term Trend: Bullish
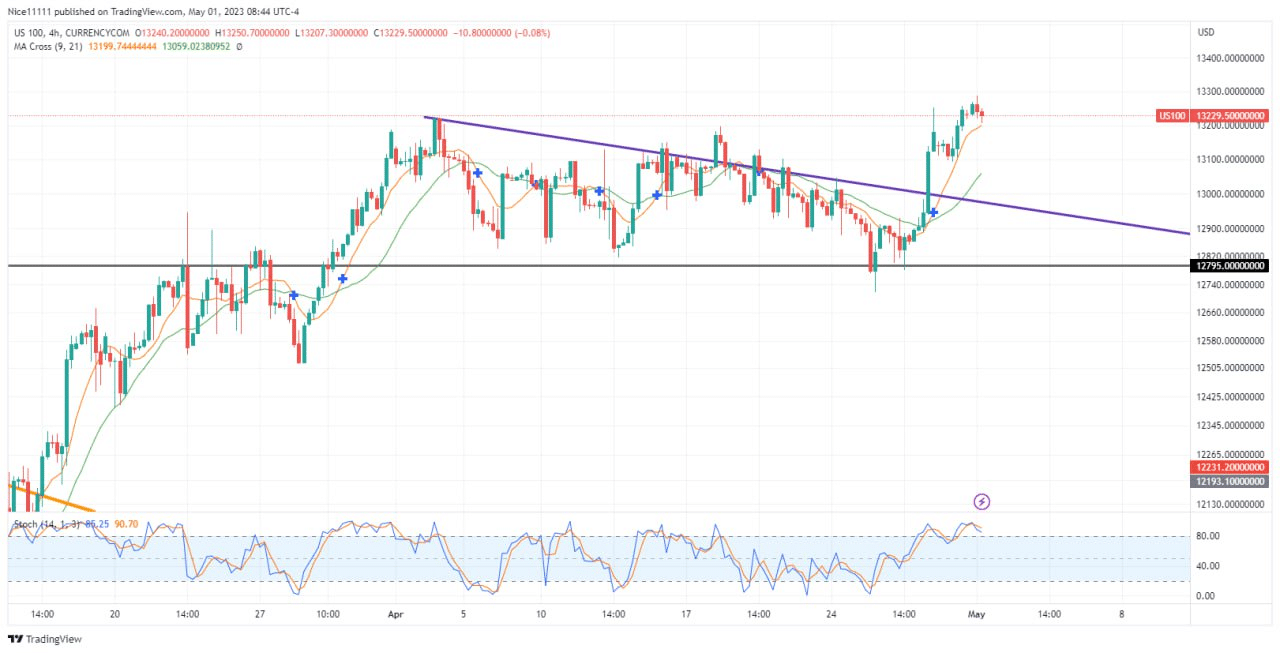
US 100 buyers were exhausted after reaching 12796.9. The impulsive displacement transformed into a correction. The market retraced to the support level of 12071.0 to gain bullish momentum. A double bottom chart pattern signaled the readiness of the buyers to launch. The bearish trendline was broken at the cross of the moving Averages ( periods nine and twenty-one) to continue the uptrend.
After the emergence of the price above 12795.0, the same key level was tested. The price took off for 13638.0 but paused and reversed abruptly. A new correction phase was organized for a retest of 12795.0. The bearish trendline on the daily chart was broken as the market escaped from the oversold region on the Stochastic.
US 100 Short-Term Trend: Bearish
The market is overbought on the daily and four-hour charts. A retest of the bearish trendline is therefore anticipated to aid the price rise to 13638.0
You can purchase Lucky Block – Guide, Tips & Insights | Learn 2 Trade here. Buy LBLOCK
Note: Learn2.trade is not a financial advisor. Do your research before investing your funds in any financial asset or presented product or event. We are not responsible for your investing results.
- Broker
- Min Deposit
- Score
- Visit Broker

- Award-winning Cryptocurrency trading platform
- $100 minimum deposit,
- FCA & Cysec regulated

- 20% welcome bonus of upto $10,000
- Minimum deposit $100
- Verify your account before the bonus is credited
- Fund Moneta Markets account with a minimum of $250
- Opt in using the form to claim your 50% deposit bonus
Learn to Trade
Never Miss A Trade Again

Signal Notification
Real-time signal notifications whenever a signal is opened, closes or Updated

Get Alerts
Immediate alerts to your email and mobile phone.

Entry Price Levels
Entry price level for every signal Just choose one of our Top Brokers in the list above to get all this free.