

Bulls may reinforce after a pullback
Uniswap Price Analysis – 28 November
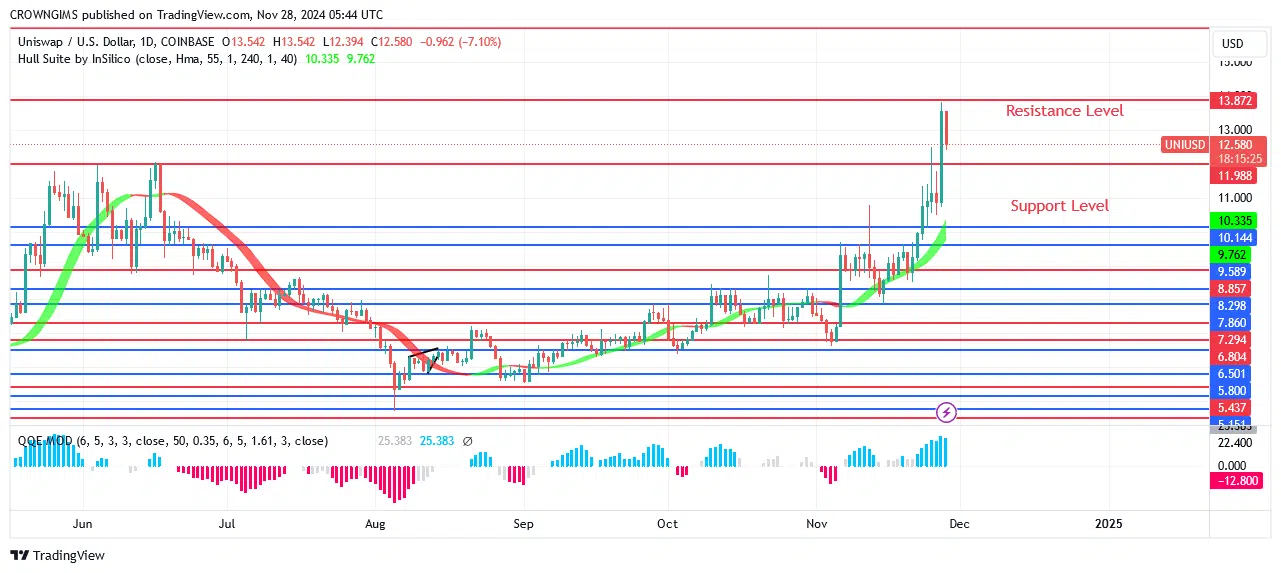
It might breach resistance levels around $13.8 and strike the $14.5 to $15.2 levels if buying pressure comes back around $13.8. If sellers are able to break through the $12.0 support level, they may try to reassess the $10.2 and $9.5 levels.
UNI/USD Market
Key Levels:
Resistance levels: $13.8, $14.5, $15.2
Support levels: $12.0, $10.2, $9.5
UNI/USD Long-term Trend: Bullish
There is no doubt that the Uniswap daily chart displays a bullish reversal indicator. The coin was expected to test the $6.5 support level on September 5 before climbing to the $9.5 resistance level. The bears clung onto their market as the price fell below $6.5. Over the past two weeks, the price of cryptocurrency has risen to $10.2. After that, it started to increase and tested the $12.0 resistance level. It is currently being reexamined in the $6.2 zone after withdrawing.
UNI/USD Medium-term Trend: Bullish
The 4-hour chart for Uniswap shows an upward trend. Price inclines began as soon as the buyers held the $10.2 barrier level. Prices hit $12.0 when the main job was completed a few days ago. This is what happened when buyers put more pressure on their market. As purchasers became increasingly apprehensive, prices climb to the predefined level; the Uniswap likewise rose in tandem with the bulls to $13.8 level. However, it is already pulling back to retest the $12.0 support level.

Start using a world-class auto trading solution
You can purchase Lucky Block here Buy LBLOCK


