Uniswap Price Analysis – April 29
In case the resistance level of $44 holds, the price will retest the support level at $37 which may extend to $30 and $26 support level. When the bulls increase pressure to break up the resistance level of $44, Uniswap price may increase to $50 and $63 price level.
UNI/USD Market
Key Levels:
Resistance levels: $44, $50, $63
Support levels: $37, $30, $26, $21
UNI/USD Long-term Trend: Bullish
Uniswap is bullish on the long-term outlook. The bulls maintain the pressure and the price increases accordingly. The support level of $30 holds and the last week resistance level was broken upside by the bulls. The price tested the resistance level at $44 yesterday. The price is pulling back at the moment.
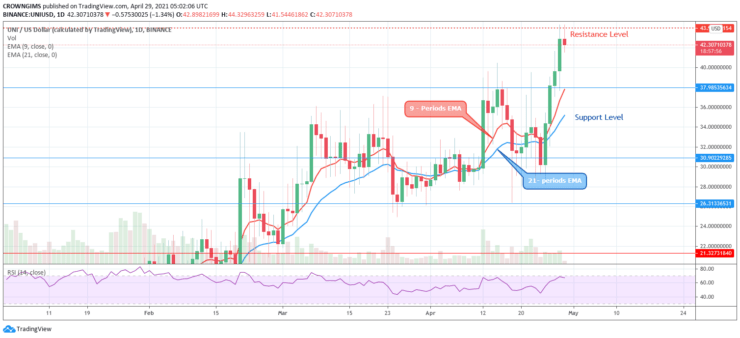
The fast moving average (9 periods EMA) retains its position above the slow moving average (21 periods EMA). Uniswap is trading above the two EMAs at a distance which indicates increase in the bulls’ momentum. In case the resistance level of $44 holds, the price will retest the support level at $37 which may extend to $30 and $26 support level. When the bulls increase pressure to break up the resistance level of $44, Uniswap price may increase to $50 and $63 price level. The Relative Strength Index is bending down at 70 levels which indicate a sell signal.
UNI/USD Medium-term Trend: Bullish
On the 4-hour market, Uniswap is bullish. Uniswap plays the way it was predicted last week. The former resistance level of $37 has turned to support level due to an increase in the bulls’ pressure. There is a tendency for an increase in the price of Uniswap. At the moment, it is carrying out price retracement.
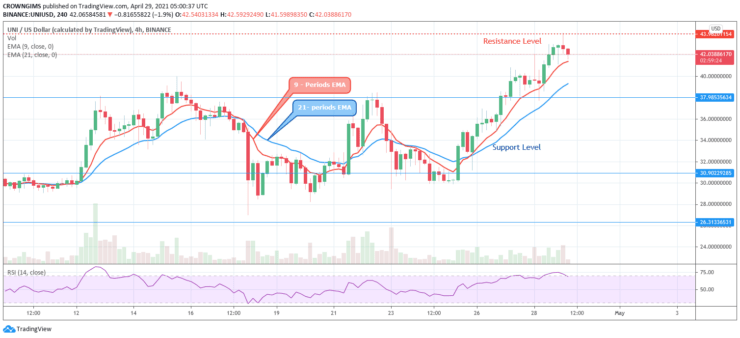
Uniswap is trading above the 9 periods EMA and 21 periods EMA as a sign of bullish movement. However, the relative strength index period 14 is pointing down at 70 levels indicating a sell signal.
You can purchase crypto coins here: Buy coins
- Broker
- Min Deposit
- Score
- Visit Broker

- Award-winning Cryptocurrency trading platform
- $100 minimum deposit,
- FCA & Cysec regulated

- 20% welcome bonus of upto $10,000
- Minimum deposit $100
- Verify your account before the bonus is credited
- Fund Moneta Markets account with a minimum of $250
- Opt in using the form to claim your 50% deposit bonus
Learn to Trade
Never Miss A Trade Again

Signal Notification
Real-time signal notifications whenever a signal is opened, closes or Updated

Get Alerts
Immediate alerts to your email and mobile phone.

Entry Price Levels
Entry price level for every signal Just choose one of our Top Brokers in the list above to get all this free.