The UK 100 bulls have taken control of the market, displaying an expansive stance in recent times. Throughout this month, the bulls have been actively seeking opportunities to reverse the trend of the UK 100 index.
UK 100 Key Zones
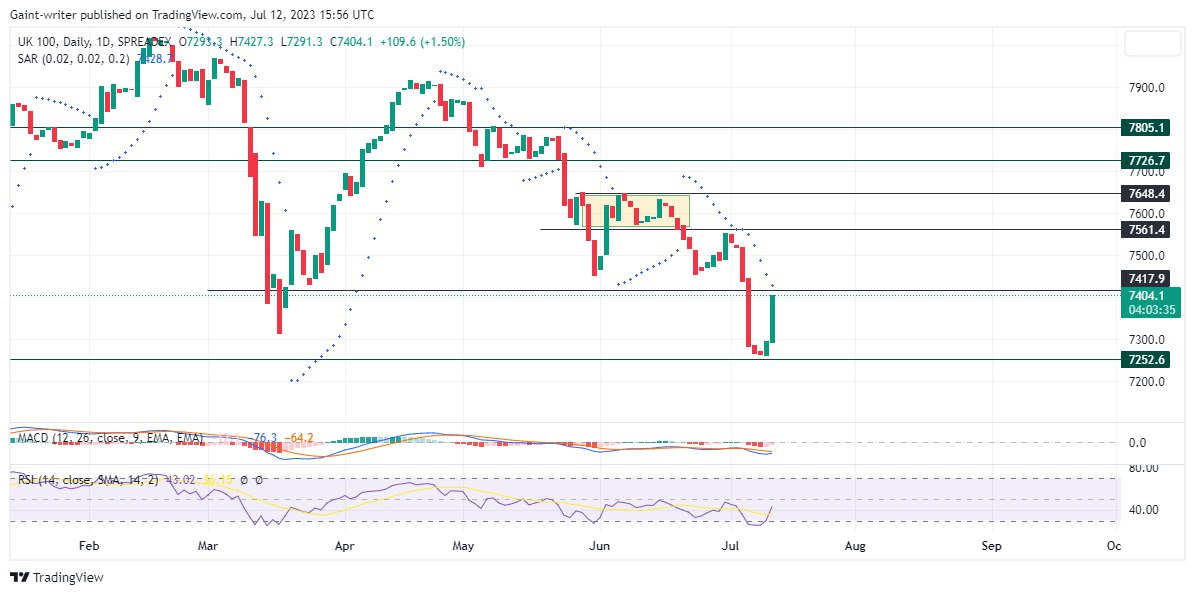
Resistance Zones: 7,727.7, 7,648.80
Support Zones: 7,417.90, 7,252.60
UK 100 Long-Term Trend: Bullish
After bouncing off the key level at 7,417.90, the sellers initiated a significant downward movement. In fact, the bears executed a strong bearish purge, breaching the 7,417.90 level. However, recent trading activity indicates that the market is gaining strength in the bullish phase, with the bulls finding support at the 7,252.60 level.
The market is poised to retest the key level at 7,417.90, as indicated by the Parabolic SAR (Stop and Reverse) indicator. This entry into a bearish phase suggests that sellers may have gained control. However, buyers may attempt to fill the liquidity pool left by the sellers, potentially allowing for a reversal later.
UK 100 Short-Term Trend: Bullish
On the 4-hour chart, the bulls maintain their optimism for a bullish continuation beyond the 7,417.90 key zone. They have managed to retain their influence over the market, although the question remains whether a breakout above the key level is imminent or if a reversal is in store.
The success of a bullish continuation relies on the strength exhibited by the market’s buyers. If the buyers can maintain control and successfully break above the key level, the market may reach new highs. Conversely, if the sellers maintain control and push the market lower, a period of instability may ensue.
You can purchase Lucky Block – Guide, Tips & Insights | Learn 2 Trade here. Buy LBLOCK
Note: Learn2.trade is not a financial advisor. Do your research before investing your funds in any financial asset or presented product or event. We are not responsible for your investing results.
Trade on MT4 with Leverage up to 1:500! Trade on MT4 with Leverage up to 1:500!
X
We use cookies to ensure that we give you the best experience on our website. If you continue to use this site we will assume that you are happy with it.

 UK 100 Short-Term Trend: Bullish


