

Bears are dominating TRON market
TRON Price Analysis – 02 August
In case the price of Crypto rises past the $0.082 resistance level and buyers remain active, the $0.085 and $0.090 resistance levels might be overcome. The price of TRON may drop to $0.079 and $0.077 levels if the sellers’ momentum exceeds the $0.081 support level.
Key Levels:
Resistance levels: $0.079, $0.081, $0.082
Support levels: 0.077, $0.074, $0.072
TRX/USD Long-term Trend: Bearish
TRON is decreasing on the daily chart. The bullish trend that started 0n 20 June pushed the price to the high of $0.085 resistance level. The bulls lost steam and the previous support level was breached. Bearish pressure was able to get through the first challenge of $0.081. Immediately, a large daily bearish candle appeared, and the price began to fall more. The previous support levels of $0.081, $0.079, and $0.081 now function as resistance levels. The immediate level of support for the coin is $0.077.
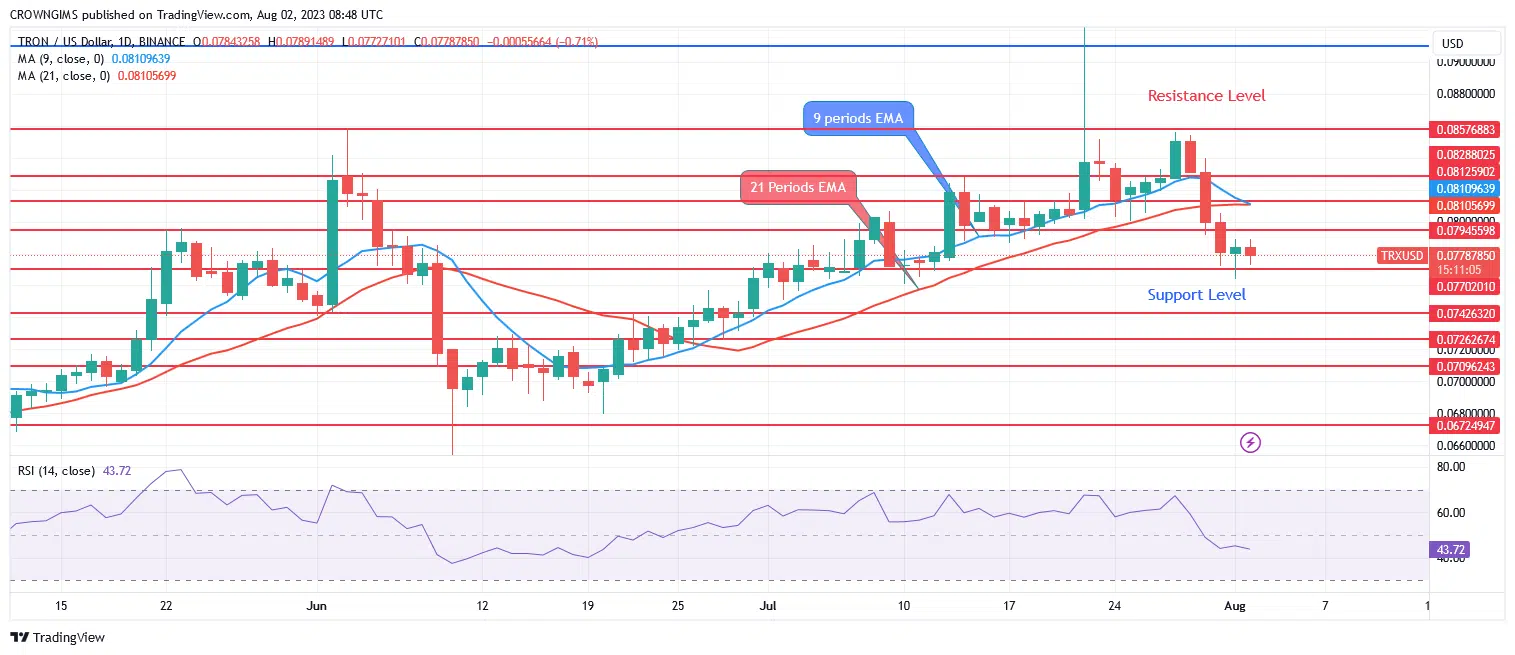
The fast EMA is crossing the slow EMA at the moment, the coin trades below the dynamic resistance levels. The price of TRON may drop to $0.074 and $0.072 levels if the sellers’ momentum exceeds the $0.077 support level. In case the price of Crypto rises past the $0.079 resistance level and buyers remain active, the $0.081 and $0.082 resistance levels might be overcome.
TRX/USD Medium-term Trend: Bearish
The movement of TRON is bearish on the 4-hour chart. A bullish reversal chart pattern called a double bottom formed at $0.070 zone. The price began to soar higher as the bulls gained momentum. The price reached the resistance level of $0.094 level. Sellers opposed the movement and the price is declining at the moment.

TRON is currently trading below exponential moving averages of 9 and 21 periods. The relative strength index’s period 14 signal line is pointing lower at level 34, providing a sell signal.
You can purchase crypto coins here: Buy LBLOCK


