Bulls’ momentum decreases in TRON’s market
TRON Price Analysis – 15 November
The price of TRON may surpass the $0.110 and $0.121 barriers if the buying momentum surges above the resistance level at $0.104. Should sellers persist and TRON drops below $0.097, it may be possible to breach the support levels of $0.094 and $0.090.
Key Levels:
Resistance levels: $0.104, $0.110, $0.112
Support levels: $0.097, $0.094, $0.090
TRX/USD Long-term Trend: Bullish
On the daily chart, TRON is presently trading in the green. The upward trend peaked on 03 October at $0.090, having begun on August 18. Buyers were able to hold the price as it tried to fall below the mentioned level. The price rise to test the $0.097 level throughout the preceding two weeks. The pressure from purchasers is increasing in the market. On October 15, a bullish engulfing candle appeared, and the price began to rise further. The $0.112 resistance level is tested as buyer pressure increases. At the moment, it is pulling back.
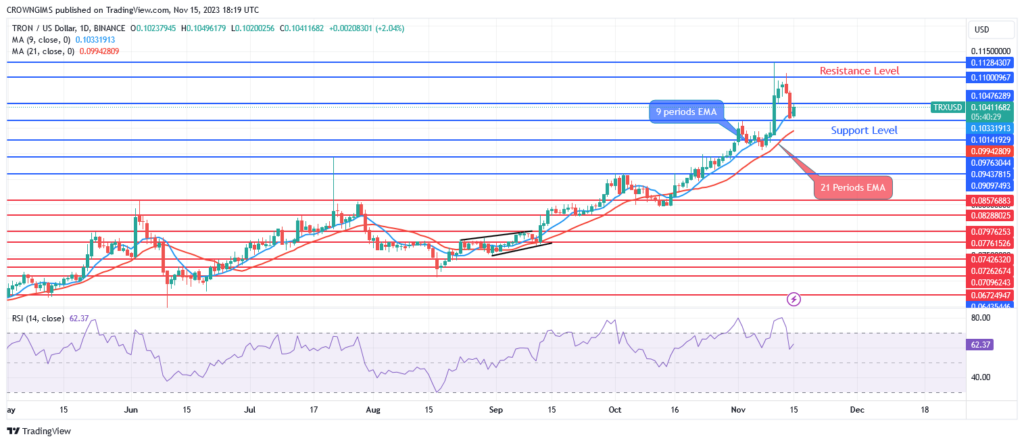
The price of the currency has risen above the dynamic support levels as a result of the fast EMA crossing the slow EMA higher. The price of TRON may surpass the $0.110 and $0.121 barriers if the buying momentum surges above the resistance level at $0.104. Should sellers persist and TRON drops below $0.097, it may be possible to breach the support levels of $0.094 and $0.090.
TRX/USD Medium-term Trend: Bearish
The price trend on the 4-hour chart of TRON is bearish. The bulls’ exultation subsided when TRON tested the $0.110 resistance level and was unable to break through. For a week, it swings around the level. The previously noted resistance level is still being tested by bulls, Sellers defend $110 level and the price is falling.
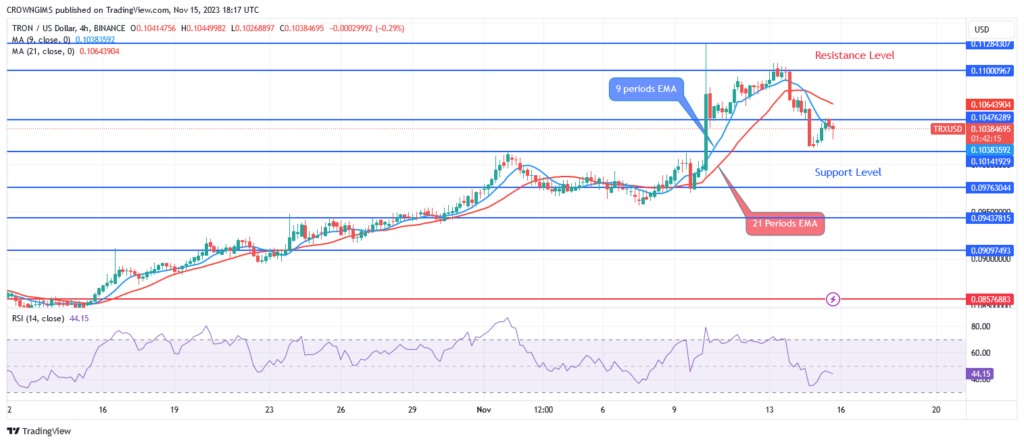
TRON’s price is currently below the 9- and 21-period exponential moving averages. At level 43, the period 14 signal line of the relative strength index is pointing downward, indicating a sell.
You can purchase crypto coins here: Buy LBLOCK
- Broker
- Min Deposit
- Score
- Visit Broker

- Award-winning Cryptocurrency trading platform
- $100 minimum deposit,
- FCA & Cysec regulated

- 20% welcome bonus of upto $10,000
- Minimum deposit $100
- Verify your account before the bonus is credited
- Fund Moneta Markets account with a minimum of $250
- Opt in using the form to claim your 50% deposit bonus
Learn to Trade
Never Miss A Trade Again

Signal Notification
Real-time signal notifications whenever a signal is opened, closes or Updated

Get Alerts
Immediate alerts to your email and mobile phone.

Entry Price Levels
Entry price level for every signal Just choose one of our Top Brokers in the list above to get all this free.