Tron Price Analysis – August 03
In case bulls put in more pressure, the break out may occur at the upper trend line of the ascending triangle and the resistance level of $0.069 may not hold, which may lead to further uptrend towards $0.070 and $0.072 levels.
TRX/USD Market
Key Levels:
Resistance levels: $0.069, $0.070, $0.072
Support levels: $0.066, $0.064, $0.061
TRX/USD Long-term Trend: Ranging
TRX/USD was in a side way trend last week. The price has fallen into the previous range bound zone. The cryptocurrency fluctuates between the resistance levels of $0.070 and the support levels of $0.064. The coin started its sideways trend immediately it moved up on July 09, towards the resistance levels of $0.070 with the formation of bullish inside bar candle at the support level of $0.064 and the buyers were unable to push the price higher above the mentioned resistance level. The price fell towards the support level of $0.064.
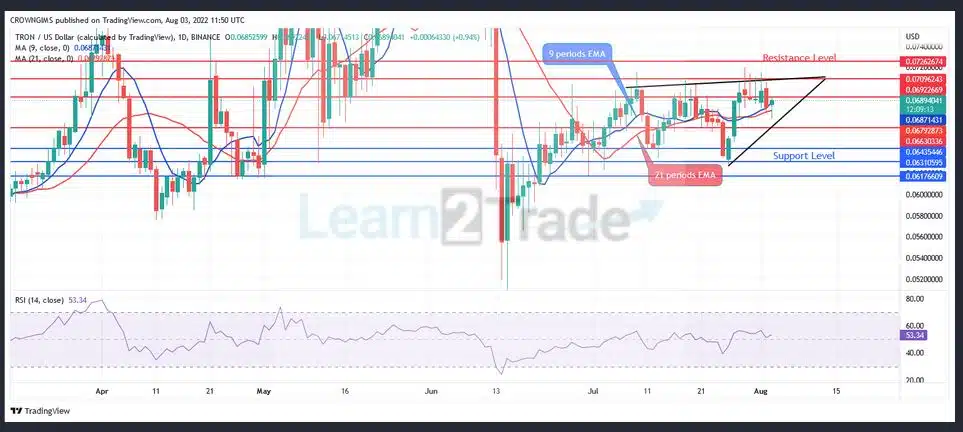
Currently, the price is trading around 9-day EMA and 21-day EMA inside the “Ascending triangle” pattern. There is a probability for a breakout of the price from the ascending triangle towards the south this week. In case bulls put in more pressure, the break out may occur at the upper trend line of the ascending triangle and the resistance level of $0.069 may not hold, which may lead to further uptrend towards $0.070 and $0.072 levels.
The relative strength index Period 14 on the daily chart is on the level 53 with the signal lines pointing upside, indicating buy signal.
TRX/USD Price Medium-term Trend: Ranging
On the 4-Hour chart, the price is on the sideways trend. There was not enough momentum for both buyers and the sellers to break the resistance upward and support downward respectively.
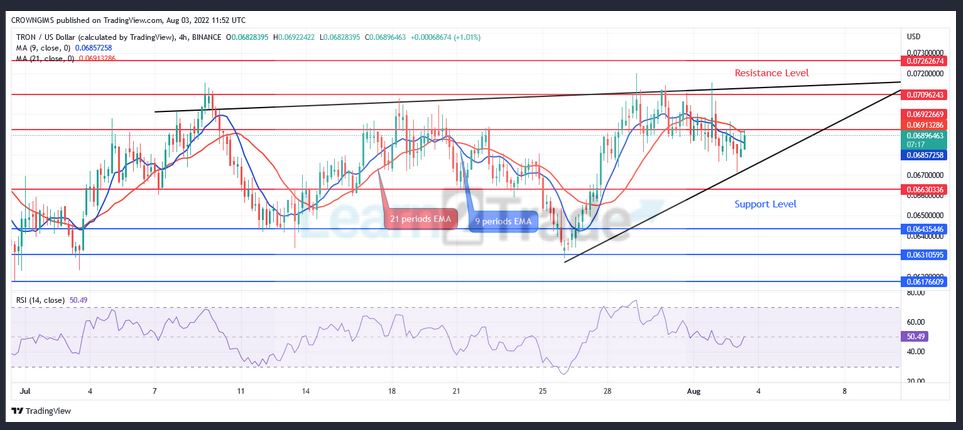
The price is consolidating within the “ascending triangle” pattern. The 9-day EMA crossed the 21-day EMA downside with the price between the two EMAs. Should bears increase their momentum there is a probability that the price will experience downtrend movement towards the support level of $0.064. Nevertheless, the relative strength index Period 14 is at 50 levels, with the signal lines directed towards the north indicate a buy signal.
You can purchase Lucky Block – Guide, Tips & Insights | Learn 2 Trade here. Buy LBLOCK
- Broker
- Min Deposit
- Score
- Visit Broker

- Award-winning Cryptocurrency trading platform
- $100 minimum deposit,
- FCA & Cysec regulated

- 20% welcome bonus of upto $10,000
- Minimum deposit $100
- Verify your account before the bonus is credited
- Fund Moneta Markets account with a minimum of $250
- Opt in using the form to claim your 50% deposit bonus
Learn to Trade
Never Miss A Trade Again

Signal Notification
Real-time signal notifications whenever a signal is opened, closes or Updated

Get Alerts
Immediate alerts to your email and mobile phone.

Entry Price Levels
Entry price level for every signal Just choose one of our Top Brokers in the list above to get all this free.