TRXUSD Price Analysis – July 27
There is a possibility for the coin to move down and test the support level of $0.061 this week. Should bears increase their pressure, the support level of $0.064 may not hold and it may be exposed to another support level of $0.063 and $0.061.
Key Levels:
Resistance levels: $0.066, $0.069, $0.070
Support levels: $0.064, $0.063, $0.061
TRX/USD Long-term Trend: Bearish
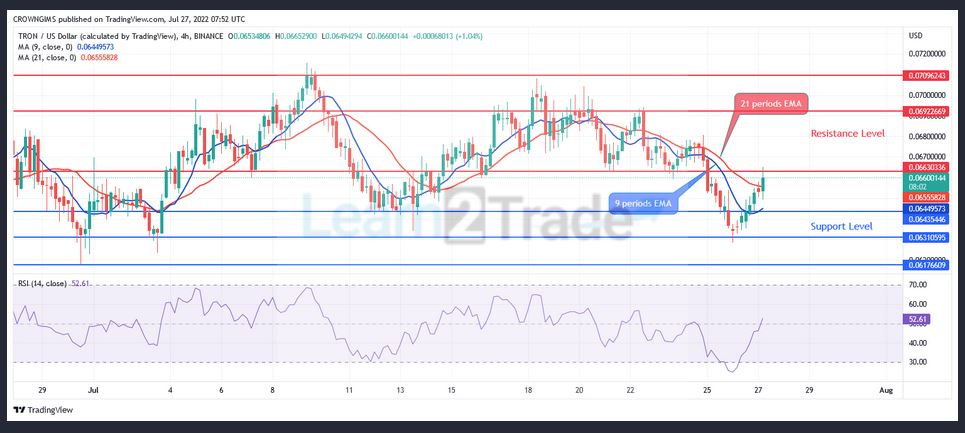
The buyers of TRX/USD were unable to push the price higher far above the resistance level of $0.070. The price fell due to the bearish pressure towards the support level of $0.066. Some bearish candles were formed which further reduces the price last week. The price dropped to $0.063, below 9-day EMA and 21-day EMA. There is a possibility for the coin to move down and test the support level of $0.061 this week. Should bears increase their pressure, the support level of $0.064 may not hold and it may be exposed to another support level of $0.063 and $0.061.
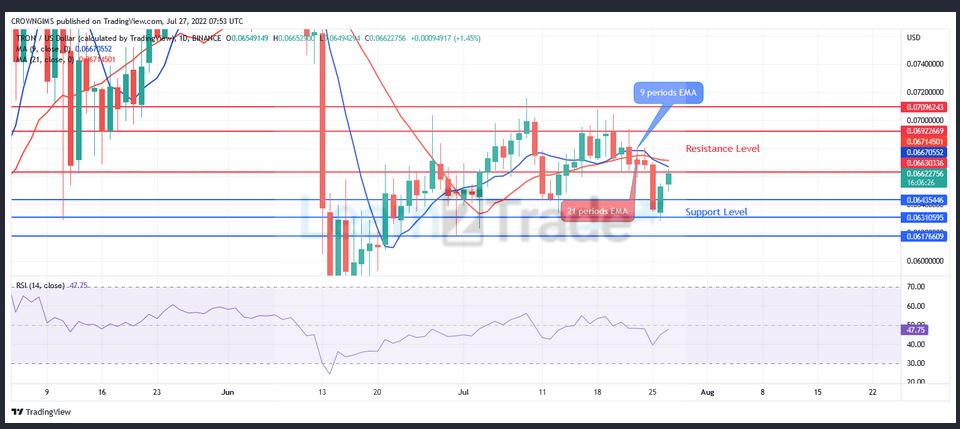
However, there is probability that the price might go up within the next several trading days, by making a break out towards the North at $0.066 as the relative strength index Period 14 on the daily chart is below the level 50 with the signal lines pointing towards the North, indicating that there could be a bullish movement this week.
TRX/USD Price Medium-term Trend: Bullish
TRX/USD on the medium term is bullish. The coin broke the last week support level of $0.064 and rallied towards the south and the price tested the support level of $0.063. A doji candle formed at the level and the price bounces above the 9-day EMA and the 21-day EMA upside, which indicates that there could be an uptrend movement towards the resistance level of $0.069.
In case more buyers come in this week there is a probability that the price will experience uptrend movement towards the resistance level of $0.069 as the relative strength Period 14 is above 50, with the signal lines directed towards the North. A radical fundamental event can forcefully bring about a significant rally in the market.
You can purchase Lucky Block – Guide, Tips & Insights | Learn 2 Trade here: Buy LBLOCK
- Broker
- Min Deposit
- Score
- Visit Broker

- Award-winning Cryptocurrency trading platform
- $100 minimum deposit,
- FCA & Cysec regulated

- 20% welcome bonus of upto $10,000
- Minimum deposit $100
- Verify your account before the bonus is credited
- Fund Moneta Markets account with a minimum of $250
- Opt in using the form to claim your 50% deposit bonus
Learn to Trade
Never Miss A Trade Again

Signal Notification
Real-time signal notifications whenever a signal is opened, closes or Updated

Get Alerts
Immediate alerts to your email and mobile phone.

Entry Price Levels
Entry price level for every signal Just choose one of our Top Brokers in the list above to get all this free.