Don’t invest unless you’re prepared to lose all the money you invest. This is a high-risk investment and you are unlikely to be protected if something goes wrong. Take 2 minutes to learn more
Almost all the coins in this week’s top five most searched cryptos are bearish. Additionally, all have been in this trend over the past seven days. Nevertheless, let’s closely examine them to spot any developments in their price action.
Arbitrum (ARB)
Major Bias : Bearish
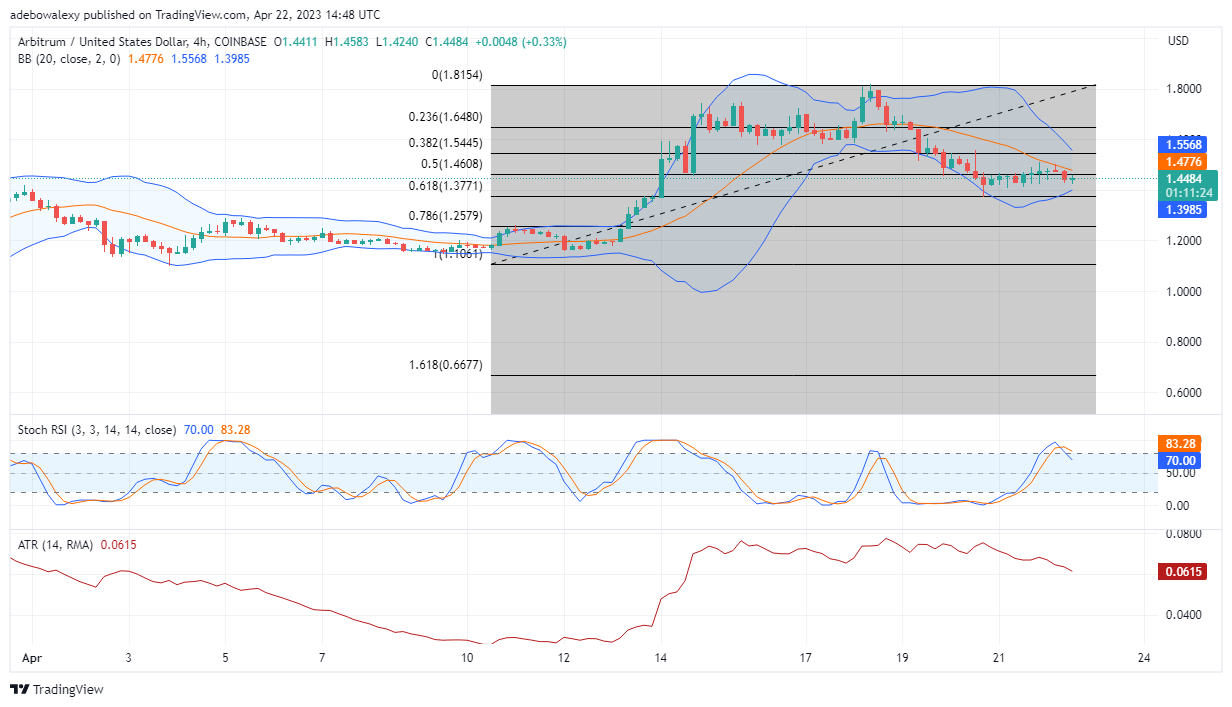
The ARBUSD market has been bearish over the past 7 days and has extended this trend even during the past 24 hours. On the 4-hour market, a green price candle has appeared below the Fibonacci Retracement level of 50 for the ongoing session. This suggests that buyers may be attempting a retracement toward the $1.46 price mark. Even so, this is still less than the recently recorded price decline over the last two trading sessions. Also, the Average True Range (ATR) indicator is pointing to the fact that the downward retracement may still be on, as its line is pointing downward. In addition, the RSI indicator has also performed a bearish crossover in the oversold area. Consequently, price action in this market still possesses a greater downward propensity and may fall towards the 1.38 mark.
Current Price: $1.45
Market Capitalization: $1,838,483,745
Trading Volume: $1,088,117,264
7-Day Gain/Loss: 14.82%
Deeper Network (DPR)
Major Bias: Bullish
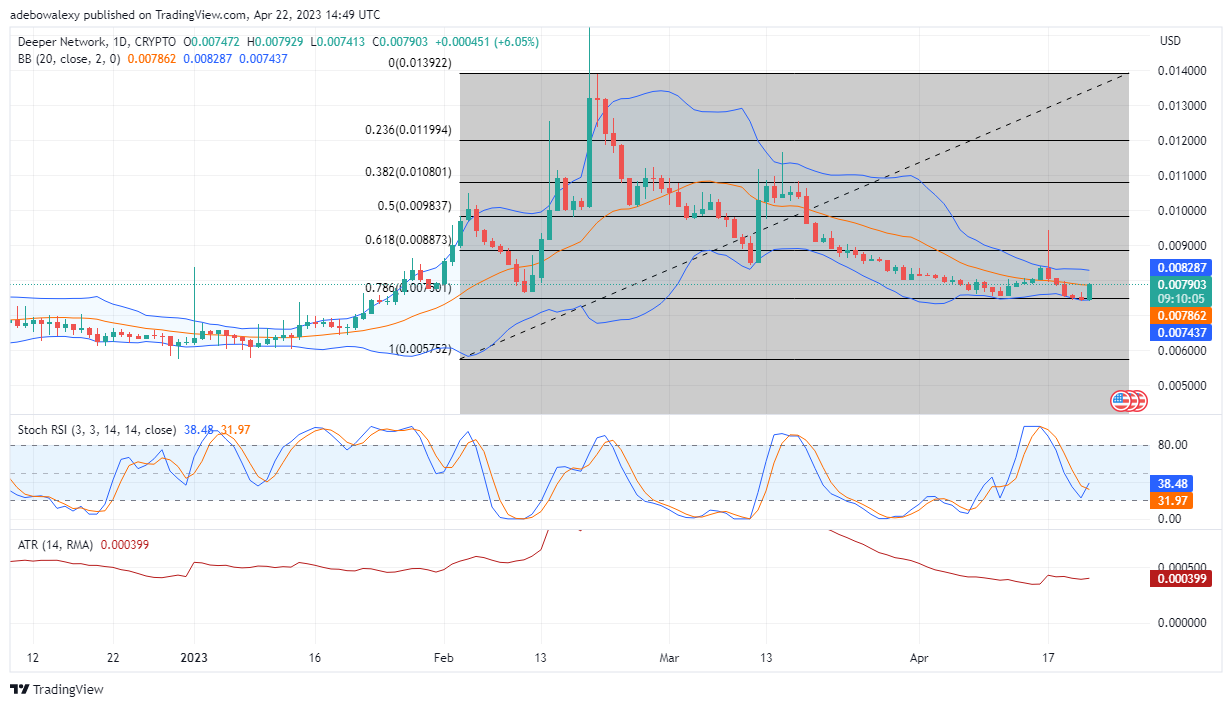
Over the past 7 days, DPRUSD has been bearish. However, today has brought a different tone to its price action and caused a moderate upside retracement of about 3.94%. On the daily chart, a green bullish price candle has appeared off the 78.60 Fibonacci level. Consequently, this has placed the current price mark at the same level as the middle limit of the Bollinger Bands indicator. Meanwhile, the Stochastic Relative Strength Index (RSI) indicator lines have crossed each other in the oversold area, while the ATR indicator line is pointed slightly upwards at the tip. Therefore, it appears that all the gathered information on this chart points to the possibility of price action retracing the $0.00830 mark.
Current Price: $0.00790
Market Capitalization: $13,207,215
Trading Volume: $1,226,175
7-Day Gain/Loss: 2.35%
Bitcoin (BTC)
Major Bias: Bearish
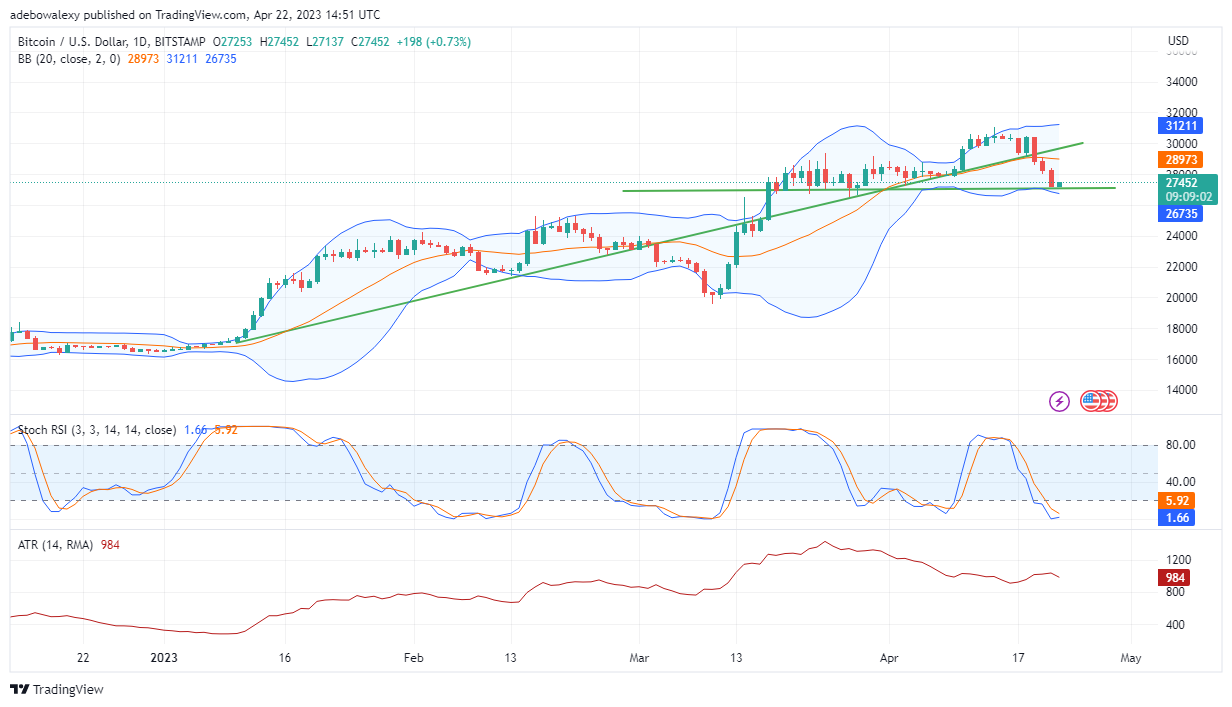
Over the past 24 hours and 7 days, BTCUSD has remained bearish after breaking above the $30,000 price mark. It appears that a significant number of traders are going short in this market, and this has resulted in a downside retracement that tore through the upside-sloping trendline on the daily chart. However, the appearance of a green price candle on the horizontal trendline The ATR indicator is pointed slightly towards the 800 mark of the indicator from 984. Meanwhile, the RSI is approaching a crossover in the oversold area. If buyers can pile in enough buying pressure at the $27,400 mark, price action may rebound toward the $28,200 mark.
Current Price: $27,322.78
Market Capitalization: $528,788,687,456
Trading Volume: $16,544,218,937
7-Day Gain/Loss: 10.12%
Shiba Inu (SHIB)
Major Bias: Bearish
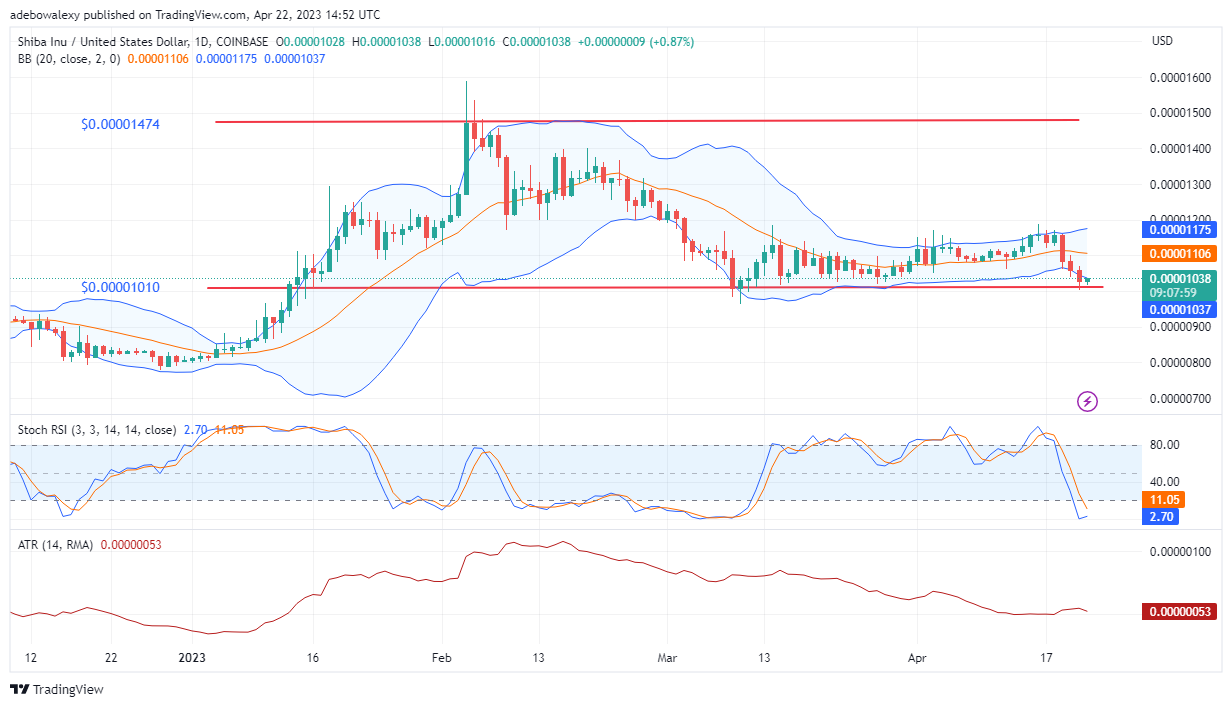
Shiba Inu seems not to have gained any traction from the fundamentals surrounding the Shibarium blockchain. This can be seen as the coin has stayed bearish over the past 7 days and in the past 24 hours. Shiba Inu declined in price by 3.10% on the day, while a loss of 8.56% spread over 7 days. On the daily SHIBUSD chart, a tiny green price candle has just appeared off the floor of the Bollinger Bands indicator. Meanwhile, the RSI curves are also preparing for a crossover in the oversold area. However, going by the ATR, the price trend seems to have turned from sideways to bearish at this point. Nevertheless, the appearance of the last price candle here seems to suggest that prices may rebound upwards toward the $0.00001060 mark.
Current Price: $0.00001030
Market Capitalization: $6,074,050,306
Trading Volume: $176,776,124
7-Day Gain/Loss: 8.56%
Space ID (ID)
Major Bias: Bearish
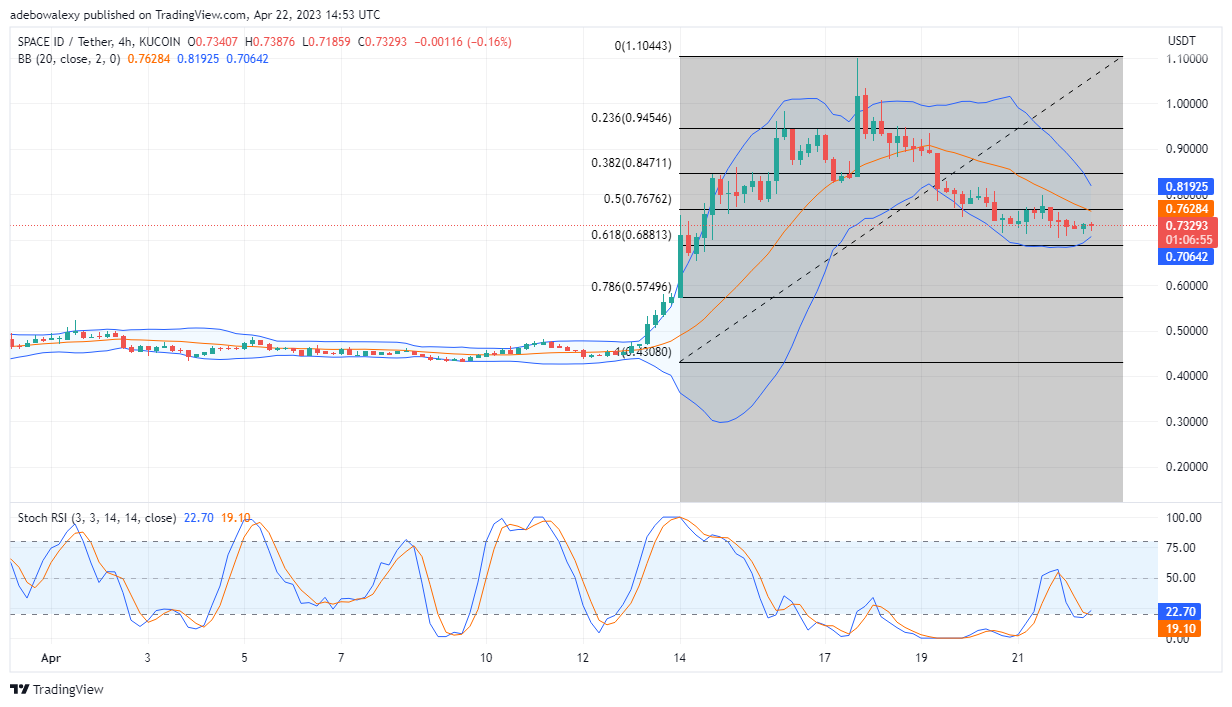
The Space ID coin seems to have dropped two places from its last week’s position at the number 3 spot. The coin has recorded a 5.39% loss today, which is a huge part of its 7 days’ losses. However, trading indicators are showing some positive signs. Examining the Bollinger Bands, one will see that the upper and lower limits are contracting. Interestingly, at the same time, a crossover has occurred in the oversold region of the RSI indicator on this chart. The indications coming from the two trading indicators in this market suggest an impending upside price move in this market. Therefore, traders can anticipate a move toward the $0.7630 mark.
Current price: $0.7329
Market capitalization: $220,675,186
Trading volume: $303,708,092
7-Gay Gain/Loss: 12.39%
Do you want to take your trading to the next level? Join the best platform for that here.
- Broker
- Min Deposit
- Score
- Visit Broker
- Award-winning Cryptocurrency trading platform
- $100 minimum deposit,
- FCA & Cysec regulated
- 20% welcome bonus of upto $10,000
- Minimum deposit $100
- Verify your account before the bonus is credited
- Fund Moneta Markets account with a minimum of $250
- Opt in using the form to claim your 50% deposit bonus
Learn to Trade
Never Miss A Trade Again

Signal Notification
Real-time signal notifications whenever a signal is opened, closes or Updated

Get Alerts
Immediate alerts to your email and mobile phone.

Entry Price Levels
Entry price level for every signal Just choose one of our Top Brokers in the list above to get all this free.


