
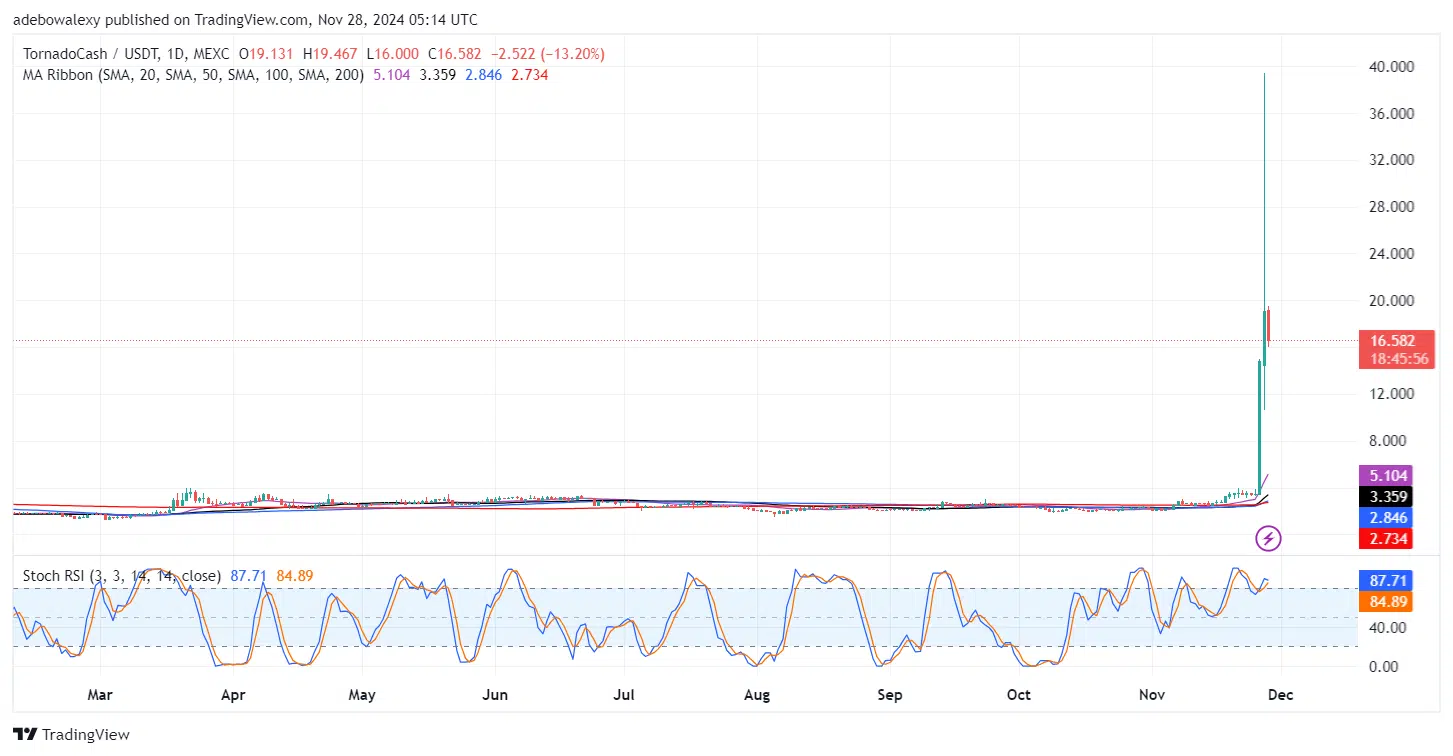
The Tornado Cash market has generally seen a considerable surge in market activity, especially recently after an extended period of dwindled market activity. However, the ongoing session has produced moderate downward retracements, but it stands that the market may continue upward.
TORN’s Statistics:
Tornado Cash Price: $16.58
Tornado Cash Market Capitalization: $90.43M
TORN Circulating Supply: 5.26M
Tornado Cash Total Supply: 10M
TORN CoinMarketCap Rank: 504
Key Price Levels:
Resistance: $20, $30, $40
Support: $16, $11, $6
TORN/USDT Stands at Crossroads
As mentioned earlier, the Tornado Cash daily market has seen a moderate price downward retracement as of the current session. As a result, the current session can be seen standing just at the technical support level at $16. The mentioned price level lies above all the Moving Average (MA) lines. The continued downward retracement can be seen to have caused a deflection on the leading lines of the Stochastic Relative Strength Index (RSI) lines.
The Stochastic RSI curves are in the overbought region but seem to tend towards a bearish crossover. Nevertheless, even a crossover here may not significantly impact bullish sentiment as price action in the market stands a great distance above the MA lines. Consequently, upside forces have a large room for easy re-entry into the market.

Tornado Cash Downward Retracement Stays at Bay at $16 Mark
Price activity in the TORN token 4-hour chart can be seen standing just above the $16 mark as technical support. This has been on since the previous session, and the mentioned price level has stayed unbroken. Also, as a result, price action stays at a significant distance above all the MA lines.
Meanwhile, the Stochastic RSI lines are now falling into the oversold region after aborting a bullish crossover. Consequently, traders can anticipate a rebound off this support, which appears to be a strong support level. This may cause the market to initially focus on the $20 price level and subsequently the $30 mark.


