Bitcoin SV Price Analysis – September 08
The ability to break up the two dynamic resistance levels will place the price at $185; a further increase in bulls’ pressure will place the price at the next resistance levels at $198 and $217.
BSV/USD Market
Key Levels:
Resistance levels: $185, $198, $217
Support levels: $153, $134, $130
BSV/USD Long-term Trend: Bearish
Last week’s target was reached as it can be seen on the daily chart. A complete short “M” shape is formed and the price reached the support level at $153. The bears’ strength seems to be weakened at the $153 level because BSV price is changing direction. The bulls are increasing their momentum gradually towards the resistance level of $185. At the moment, the price is testing the dynamic resistance levels. In other words, the price is carrying out retracement.
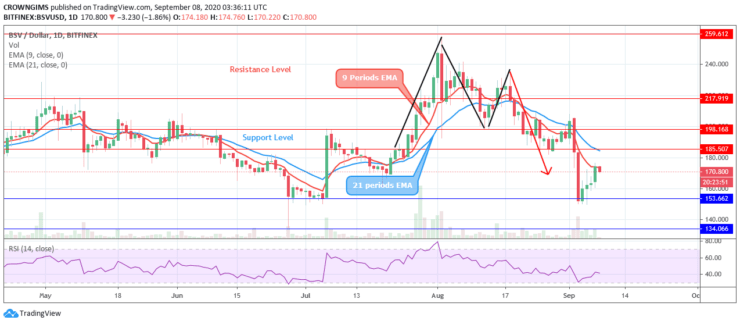
BSV market is opening today with a bearish candle which indicates that the bears may dominate the market today. The price is trading below the 9 periods EMA while 21 periods EMA is above the two. The ability to break up the two dynamic resistance levels will place the price at $185; a further increase in bulls’ pressure will place the price at the next resistance levels at $198 and $217. The inability to break up the resistance level of $185 may reverse the price towards the south to face the support levels at $153, $134, and $130. However, the relative strength index period 14 is at 40 levels with the signal line bending down to indicate the sell signal.
BSV/USD Medium-term Trend: Bullish
BSVUSD is bullish in the 4-hour chart. The bearish momentum BSV market experienced last week bottomed the price at the support level $153. The mentioned support level holds and the price and could not decrease further. Then, it reverses with the formation of bullish candles; the price crosses the two EMAs upside moving towards $185 level.
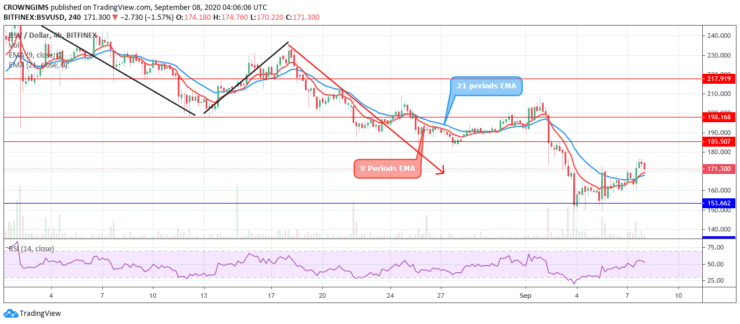
At the moment, the price is trading above the 9 periods EMA and 21 periods EMA. The Relative Strength Indicator is pointing downside to indicate a sell signal which may be a pullback. The price may increase to $198 price level.
- Broker
- Min Deposit
- Score
- Visit Broker

- Award-winning Cryptocurrency trading platform
- $100 minimum deposit,
- FCA & Cysec regulated

- 20% welcome bonus of upto $10,000
- Minimum deposit $100
- Verify your account before the bonus is credited
- Fund Moneta Markets account with a minimum of $250
- Opt in using the form to claim your 50% deposit bonus
Learn to Trade
Never Miss A Trade Again

Signal Notification
Real-time signal notifications whenever a signal is opened, closes or Updated

Get Alerts
Immediate alerts to your email and mobile phone.

Entry Price Levels
Entry price level for every signal Just choose one of our Top Brokers in the list above to get all this free.