NEO Price Analysis – November 09
When the bulls push up the price to break up the two dynamic resistance levels, the bulls may likely break up the resistance level of $16 and expose the price to $19 and $22 price level. In case the dynamic resistance levels hold the price, bearish momentum may continue towards the support level of $13, $12, and $9.
NEO/USD Market
Key Levels:
Resistance levels: $16, $19, $22
Support levels: $13, $12, $9
NEO/USD Long-term Trend – Bearish
NEOUSD is bearish in the daily chart. The bears are still in control of NEO market since 23 October. The coin has reduced to the support level of $13 after it penetrates the support level of $14. Last week, it seems the bearish pressure is getting weak and the bulls’ momentum is not strong enough to push up the price. The price is trying to break up the dynamic resistance level but unable till the period of written this report.
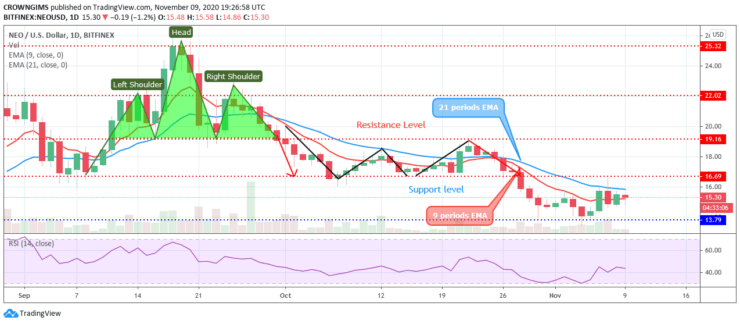
The price is consolidating below and in between the 9 periods EMA and 21 periods EMA which indicates that the momentum of the bears and bulls’ momentum is at equilibrium. When the bulls push up the price to break up the two dynamic resistance levels, the bulls may likely break up the resistance level of $16 and expose the price to $19 and $22 price level. In case the dynamic resistance levels hold the price, bearish momentum may continue towards the support level of $13, $12, and $9. The relative strength index period 14 is bending down at 40 levels to indicate a sell signal.
NEO/USD Medium-term Trend – Bearish
NEO is bearish in the medium-term outlook; the price found support at $13 on November 04. The same day, a bullish engulfing candle pattern emerges and the price increases to test the resistance level of $16. The bears defend the just mentioned resistance level and the price pulls back and began consolidation.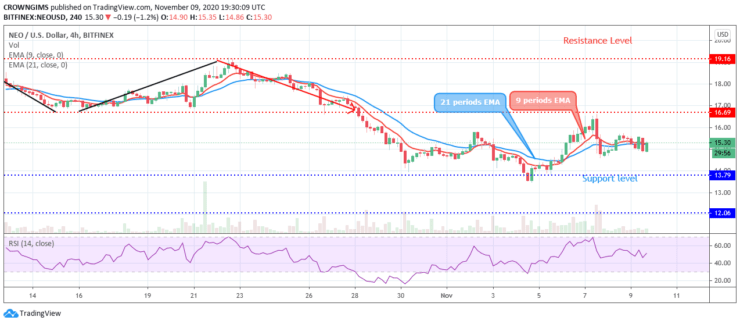
The 9 periods EMA is interlocking to the 21 periods EMA while the price is trading over and around the two EMAs. The relative strength index period 14 is not displaying a specific direction which indicates that consolidation is in progress.
- Broker
- Min Deposit
- Score
- Visit Broker

- Award-winning Cryptocurrency trading platform
- $100 minimum deposit,
- FCA & Cysec regulated

- 20% welcome bonus of upto $10,000
- Minimum deposit $100
- Verify your account before the bonus is credited
- Fund Moneta Markets account with a minimum of $250
- Opt in using the form to claim your 50% deposit bonus
Learn to Trade
Never Miss A Trade Again

Signal Notification
Real-time signal notifications whenever a signal is opened, closes or Updated

Get Alerts
Immediate alerts to your email and mobile phone.

Entry Price Levels
Entry price level for every signal Just choose one of our Top Brokers in the list above to get all this free.