The NZDUSD Support Zone Becomes Threatened

Azeez Mustapha

Updated:

Unlock Daily Forex Signals

Select a Plan

£39

1 - month
Subscription

Select

£89

3 - month
Subscription

Select

£129

6 - month
Subscription

Select

£399

Lifetime
Subscription

Select

£50

Separate Swing Trading Group

Select

Or

Get VIP forex signals, VIP crypto signals, swing signals, and forex course free for lifetime.

Just open an account with one our affiliate broker and make a minimum deposit: 250 USD.

Email [email protected] with a screenshot of funds on account to get access!

Sponsored by

Sponsored Sponsored
Checkmark

Service for copy trading. Our Algo automatically opens and closes trades.

Checkmark

The L2T Algo provides highly profitable signals with minimal risk.

Checkmark

24/7 cryptocurrency trading. While you sleep, we trade.

Checkmark

10 minute setup with substantial advantages. The manual is provided with the purchase.

Checkmark

79% Success rate. Our outcomes will excite you.

Checkmark

Up to 70 trades per month. There are more than 5 pairs available.

Checkmark

Monthly subscriptions begin at £58.


Market Analysis – April 3

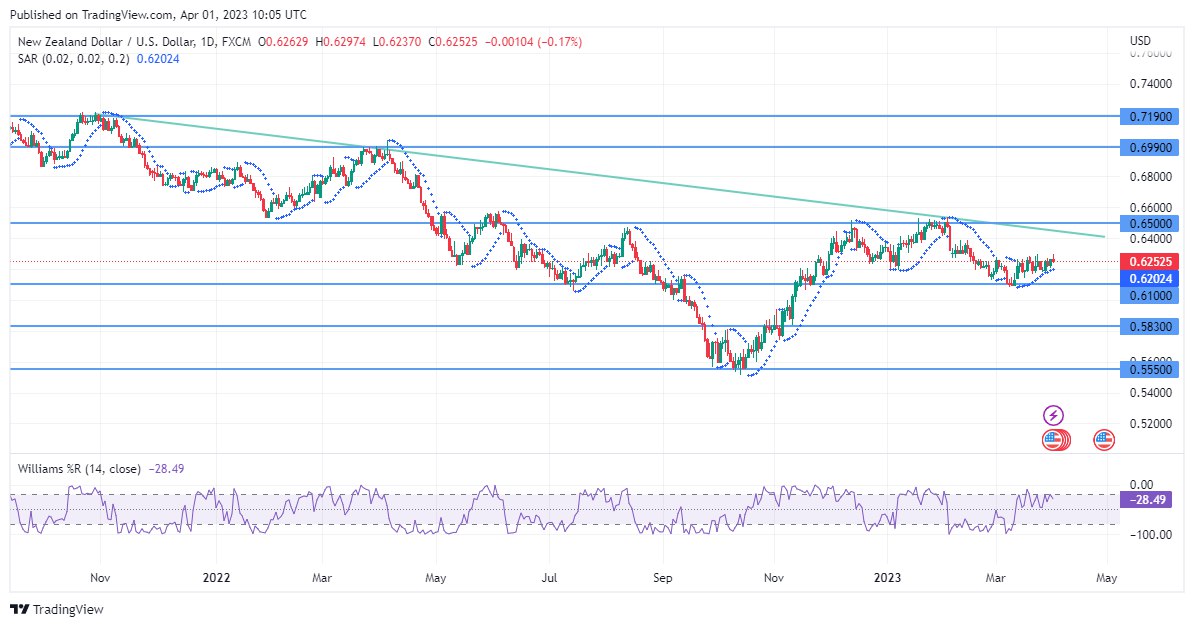
NZDUSD price experienced a decline after reaching the descending trendline on the daily chart. The market tested the descending trendline at the supply zone of 0.6500. The price has fallen to the support level of 0.6100.

NZDUSD Key Levels

Resistance Levels: 0.6500, 0.6990, 0.7190
Support Levels: 0.6100, 0.5830, 0.5550

The NZDUSD Support Zone Becomes ThreatenedNZDUSD Long-term Trend: Bearish

Major highs on the 24-hour chart were formed in November and April 2022. During these periods, the market tested resistance levels as the Williams Percent Range (Williams R) indicated the market was overbought. This caused a decline in the price of the NZDUSD. The major highs have been anchored by a descending trendline on the 24-hour chart. After several months, the market returned to the bearish trendline.

The sellers utilized the opportunity at the test of the 0.6550 key level. The Williams Percent Range revealed the market was well overbought. The Parabolic SAR (Stop and Reverse) indicator formed points above the daily candles to indicate bearishness. The price decline has been halted at the support level of 0.6100. The test at 0.6100 caused a bounce off the significant level. The Buyers appear to defend the zone.The NZDUSD Support Zone Becomes Threatened

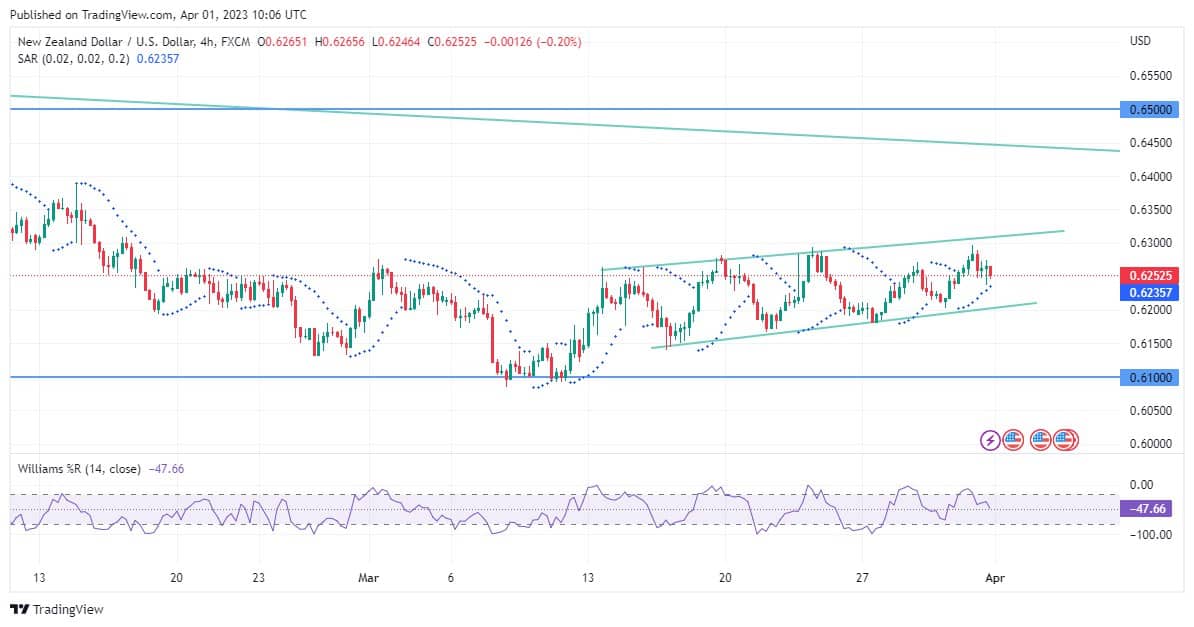
NZDUSD Short-term Trend: Bearish

On the lower timeframe, 4-hour candlesticks are well assembled in a gently sloping parallel channel. While the Williams Range is overbought on the daily chart, the Williams Range is already recovering from the overbought zone on the four-hour chart. A bearish breakout is anticipated to attack the support level of 0.6100 once again.

Do you want to take your trading to the next level? Join the best platform for that here 

  • Broker
  • Benefits
  • Min Deposit
  • Score
  • Visit Broker
  • Award-winning Cryptocurrency trading platform
  • $100 minimum deposit,
  • FCA & Cysec regulated
$100 Min Deposit
9.8
  • 20% welcome bonus of upto $10,000
  • Minimum deposit $100
  • Verify your account before the bonus is credited
$100 Min Deposit
9
  • Over 100 different financial products
  • Invest from as little as $10
  • Same-day withdrawal is possible
$250 Min Deposit
9.8
  • The Lowest Trading Costs
  • 50% Welcome Bonus
  • Award-winning 24 Hour Support
$50 Min Deposit
9
  • Fund Moneta Markets account with a minimum of $250
  • Opt in using the form to claim your 50% deposit bonus
$250 Min Deposit
9

Share with other traders!

Azeez Mustapha

Azeez Mustapha is a trading professional, currency analyst, signals strategist, and funds manager with over ten years of experience within the financial field. As a blogger and finance author, he helps investors understand complex financial concepts, improve their investing skills, and learn how to manage their money.

Leave a Reply

Your email address will not be published. Required fields are marked *