Don’t invest unless you’re prepared to lose all the money you invest. This is a high-risk investment and you are unlikely to be protected if something goes wrong. Take 2 minutes to learn more
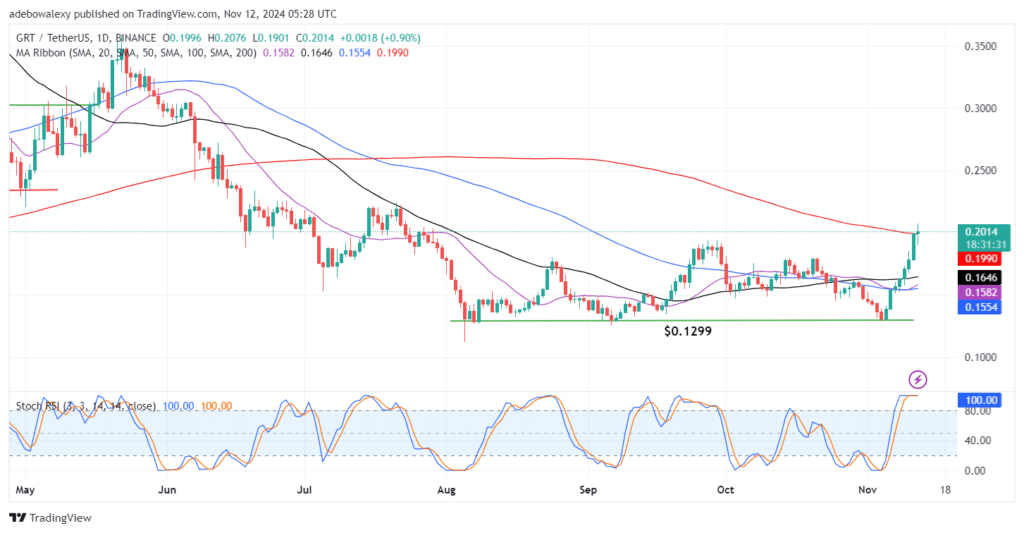
Price action in the GRT daily market has just acquired key support. This occurred after the market experienced a price increase of over 8%. This placed its price action above an important technical landmark that may signal more price increases. Let’s get into the details below.
GRT Statistics:
The Graph Price: $0.2014
GRT Capitalization: $1.93B
GRT Circulating Supply: 9.55B
GRT Total Supply: 10.80B
GRT CoinMarketCap Rank: 55
Key Price Levels:
Resistance: $0.2250, $0.2500, $0.2750
Support: $0.2000, $0.1750, $0.1500

The Graph Comes Under Pressure Above the MA Lines
Price movement in the GRT market has risen past all the Moving Average (MA) lines. Technically, it should be now that the market should proceed with much vigor. But on the contrary, the last price candle on the chart has revealed that the market is experiencing increased downward pressure at this point. Both sides of the market appeared to be contracted for the ongoing session.
Nevertheless, the token continues to trade above the MA lines. Likewise, its body sits just above the 200-day MA line. Meanwhile, the Stochastic Relative Strength Index (RSI) lines can be seen now dragging sideways at the indicator’s 100-day mark. Combining the fact that market forces are already in a face-off with the overbought condition on the RSI, a pullback may be on the horizon.

GRT Pulls Back Towards Technical Support
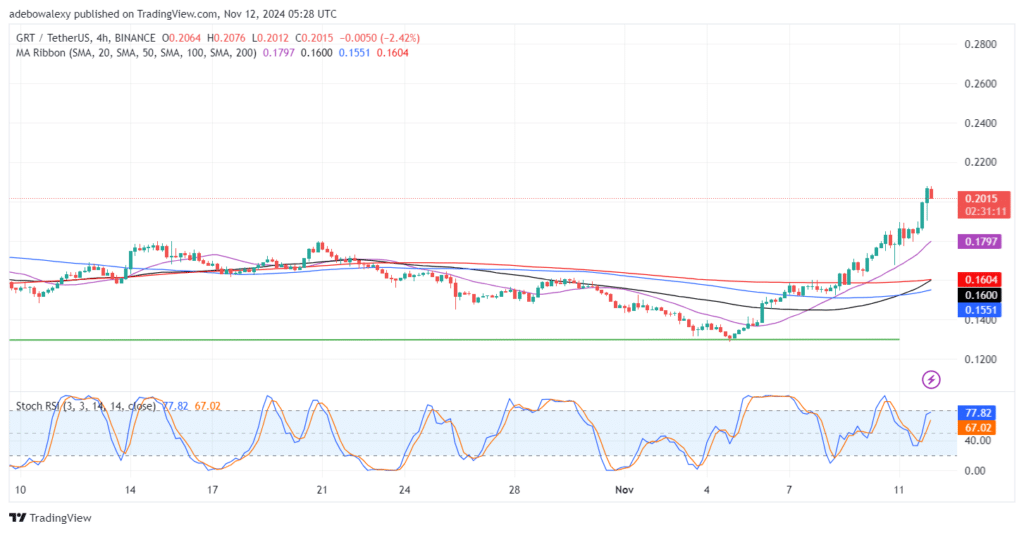
Coming to The Graph’s 4-hour chart, it could be seen that the market is pulling back as expected. Here, the last price candle has appeared bearish, pulling back the market towards the $0.2000 support level. Yet, trading activities continue above all the MA lines.
Simultaneously, while the Stochastic RSI lines can still be seen as having a generally upward trajectory, the leading line of the indicator has a deflection, which reflects the ongoing pullback on the price chart. However, it could be seen that a crossover is yet to be effected on the indicator. Since trading in this market stays above all the MA lines and a crossover is yet to occur on the Stochastic RSI, bullish crypto signals may still yield results in this market, as the market may head towards the $0.2200 and $0.2400 price levels.
Start using a world-class auto trading solution.
- Broker
- Min Deposit
- Score
- Visit Broker
- Award-winning Cryptocurrency trading platform
- $100 minimum deposit,
- FCA & Cysec regulated
- 20% welcome bonus of upto $10,000
- Minimum deposit $100
- Verify your account before the bonus is credited
- Fund Moneta Markets account with a minimum of $250
- Opt in using the form to claim your 50% deposit bonus
Learn to Trade
Never Miss A Trade Again

Signal Notification
Real-time signal notifications whenever a signal is opened, closes or Updated

Get Alerts
Immediate alerts to your email and mobile phone.

Entry Price Levels
Entry price level for every signal Just choose one of our Top Brokers in the list above to get all this free.


