Today’s trading session has brought a considerable amount of profit to the GRT market. As a result, price action in this market has reappeared once more above a key level. Also, observed signs in this market still hint that price action may advance toward higher levels.
Key The Graph Statistics:
Current GRT Value: $0.1506
GRT Market Cap: $1,404,149,129
Circulating Supply of The Graph: 9,313,743,398
Total Supply of GRT: 10,785,272,858
The Graph CoinMarketCap Ranking: 47
Key Price Levels:
Resistance: $0.1506, $0.1600, and $0.1700
Support: $0.1500, $0.1400, and $0.1300

The Graph Maintains Upside Hopes Despite Facing Moderate Rejection
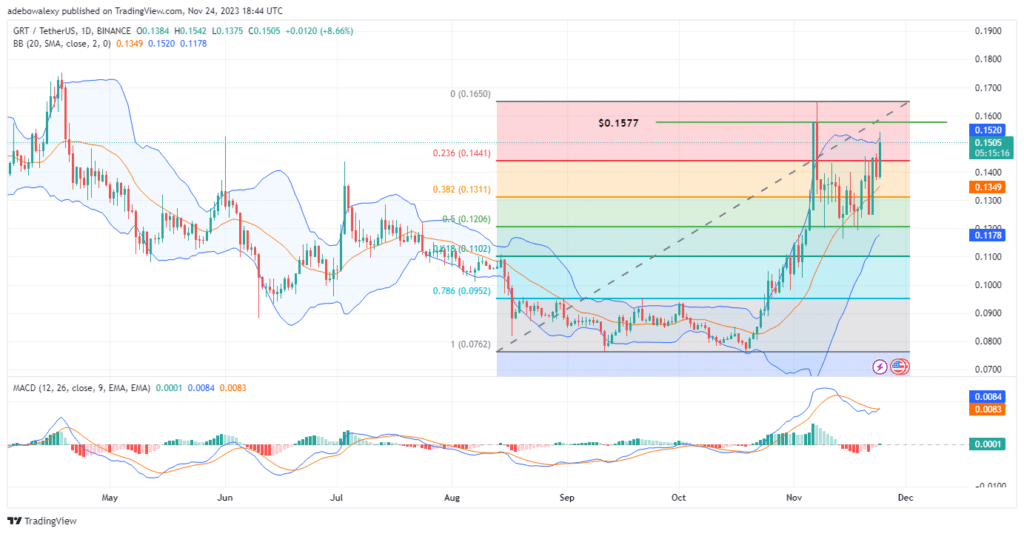
Price action in the GRT daily market seems ready to challenge a previously tested resistance at the $0.1577 mark. Here, the last price candle on this daily chart has a longer upper shadow than the lower one. Consequently, this shows that the price has been pushed a bit downward after pushing against the uppermost limit of the Bollinger Bands.
Nevertheless, bulls remain on good ground to continue on the upside path. Trading will continue above the middle band of the Bollinger Bands, while the Moving Average Convergence Divergence (MACD) indicator has displayed a bullish crossover above the equilibrium point. Also, despite the recorded rejection, a green bar has appeared above the equilibrium level, which suggests that bulls are favored.

GRT Buyers Are Holding Their Position
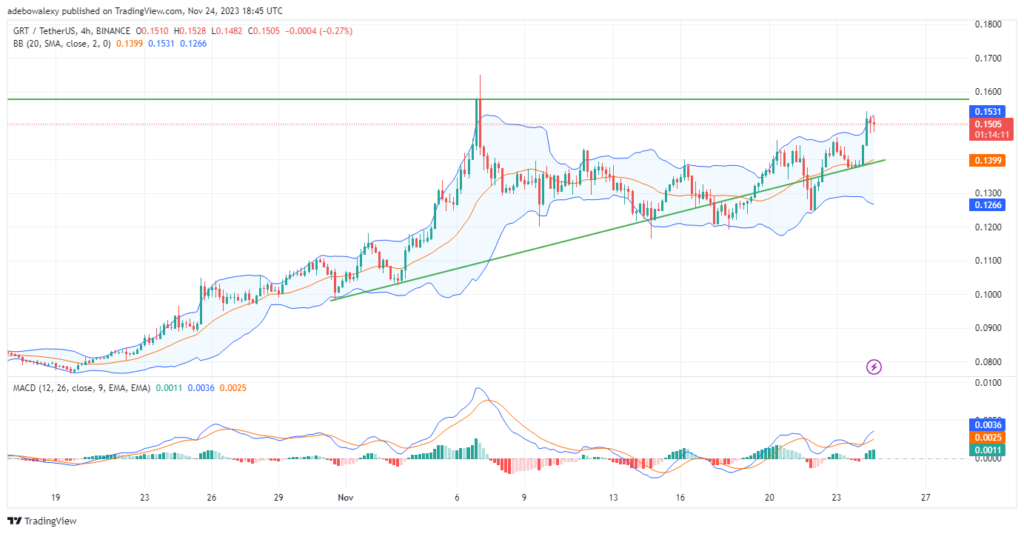
In The Graph’s 4-hour market, bears are trying to continue exerting downward pressure. However, it appears that the bulls are putting up a good fight. The last two red-price candles on this chart can be seen to have short bodies. This is indicative of the fact that bears have only been able to achieve so little.
Meanwhile, the MACD indicator lines are still green in appearance. Likewise, the lines of this indicator are still trending upward above the equilibrium point. Technically, it stands that upside forces are still strong and will likely keep prices soaring toward the $0.1577 mark.
Trade crypto coins on AvaTrade
- Broker
- Min Deposit
- Score
- Visit Broker
- Award-winning Cryptocurrency trading platform
- $100 minimum deposit,
- FCA & Cysec regulated
- 20% welcome bonus of upto $10,000
- Minimum deposit $100
- Verify your account before the bonus is credited
- Fund Moneta Markets account with a minimum of $250
- Opt in using the form to claim your 50% deposit bonus
Learn to Trade
Never Miss A Trade Again

Signal Notification
Real-time signal notifications whenever a signal is opened, closes or Updated

Get Alerts
Immediate alerts to your email and mobile phone.

Entry Price Levels
Entry price level for every signal Just choose one of our Top Brokers in the list above to get all this free.


