

XRP/USD Market September 27
In case the bulls gain more strength to break up the dynamic resistance level, the $0.25 price level may not hold and the price will reach the resistance levels at $0.27 and $0.29. The bearish movement will continue if the bulls fail to break up the confluence at the $0.25 level.
Key Levels:
Resistance levels: $0.25, $0.27, $0.29
Support levels: $0.22, $0.20, $0.17
XRP/USD Long-term Trend: Bearish
XRPUSD is bearish in the daily chart. The coin has not broken up the dynamic resistance levels but struggling to break it to confirm the bullish trend. However, the bearish movement was interrupted on September 24 with the formation of a bullish reversal pattern called Tweezer bottom. The price is increasing towards the resistance level of $0.25. The increase in price is currently opposed by the dynamic resistance level.
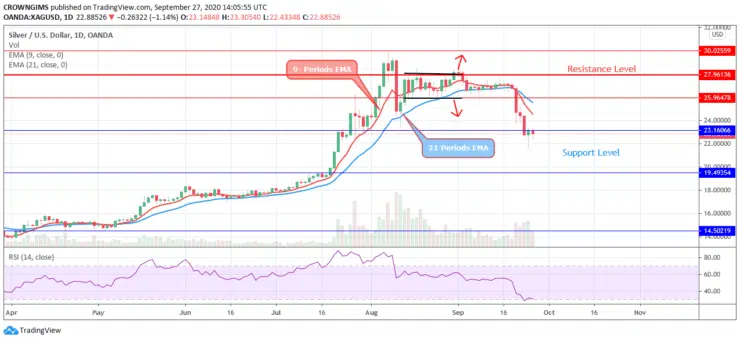
The price action forms Doji candles trading in between the two EMAs trying to break up the 21 periods EMA after passing through the 9 periods EMA. In case the bulls gain more strength to break up the dynamic resistance level, the $0.25 price level may not hold and the price will reach the resistance levels at $0.27 and $0.29. The bearish movement will continue if the bulls fail to break up the confluence at the $0.25 level. The support levels at $0.22, $0.20, and $0.17 are the barriers to watch.
XRP/USD medium-term Trend: Bullish
XRPUSD is bullish in the 4-hour chart. Immediately after the breakout of the wedge, the bears took over the market and decline to the support level of $0.22, breaks it down but unable to sustain or maintain bearish momentum. The bulls oppose the bearish movement; the price reversed moving towards the resistance level of $0.25.

The 9 periods EMA has crossed the 21 periods upside and the crypto is trading above the two EMAs. The relative strength index period 14 is pointing down at 60 levels which indicates sell and it may be a pullback.


