
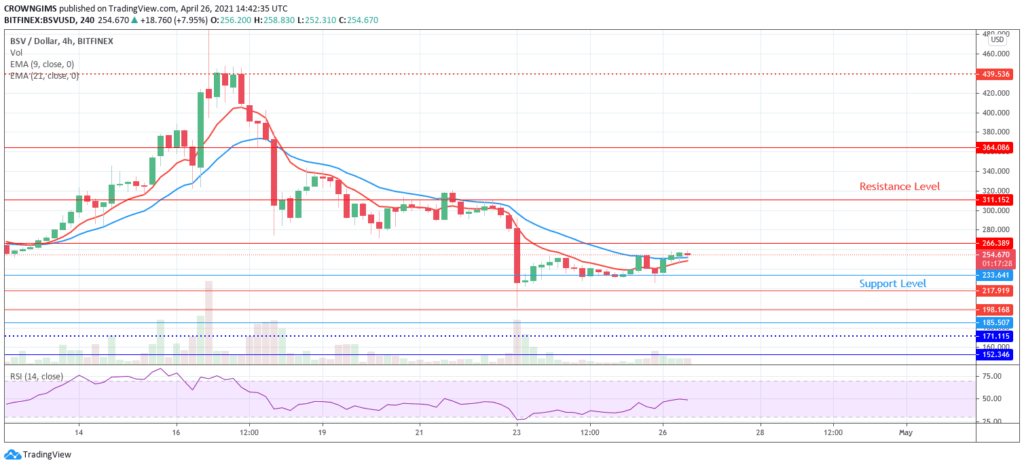
In case the bulls defend the support level of $233, there will be an increase in price towards the resistance level of $266 which may extend to $311 and $39 price levels. Further increase in the bears’ momentum may push down the coin to $233 level, which may decrease the price to $217 and $198 support levels.
BSV/USD Market
Key Levels:
Resistance levels: $266, $311, $439
Support levels: $233, $217, $198
BSV/USD Long-term Trend: Bearish
Bitcoin SV is Bearish on the daily chart. BSV increased to the resistance level of $439 on April 16. The crypto market was dominated by the buyers. The buyers’ pressure could not break up the resistance level of $439. A bearish cross candle pattern was formed at the same level; this triggered the bearish trend. More bearish candle was produced to indicate an increase in the bears’ pressure. The demand level of $233 is reached.

Bitcoin SV has penetrate the dynamic support and resistance levels downside and the price is currently trading below the 9 periods EMA and 21 periods EMA which indicate that bears are in control of Bitcoin SV market. In case the bulls defend the support level of $233, there will be an increase in price towards the resistance level of $266 which may extend to $311 and $39 price levels. Further increase in the bears’ momentum may push down the coin to $233 level, which may decrease the price to $217 and $198 support levels. However, the relative strength index period 14 is at 50 level bending up to indicate buy signal.
BSV/USD Medium-term Trend: Bullish
Bitcoin SV is bullish on the medium-term outlook. The BSV was under the control of the sellers last week. The bearish momentum push down the price to the support level of $233. The Crypto consolidates at the level for short period of time due to low bearish pressure. It seems the bears are preparing to take over the Bitcoin SV market.

The price is increasing and gradually crossing two EMAs upside. The price is trading above the 9 periods EMAs and 21 periods EMA which connotes a bullish movement. The relative strength index is displaying a bullish signal at the 50 levels which indicates an increase in price.


