Increase in the sellers’ momentum will push the Binance Coin below the support level of $503 and if the daily candlestick close below it, then, the price may decrease further to test the $420 and $364 support level. Failure to break down the support level of $503 by the bears will increase the price to the resistance levels at $599, $663, and $758.
BNBUSD Market
Key levels:
Resistance levels: $599, $663, $758
Support levels: $503, $420, $364
BNBUSD Long-term trend: Bearish
The bears are getting ready to take over the BNBUSD market. In other words Binance coin is bullish in daily chart. The bulls pushes the coin to test the resistance level at $599 on April 12. It pulled back to retest the support at $420.The price could not break down the mentioned level and pulled back. The resistance level of $599 is tested second time on April 20 to form a double top chart pattern. The price may decrease further.
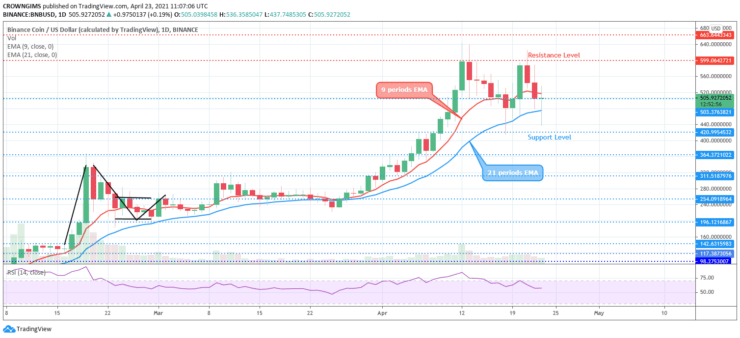
Binance Coin is penetrating the fast moving average and the price is trading in between the 9 periods EMA and 21 periods EMA which indicate that the bears are gaining upper hand in the Binance coin market. The Relative Strength Index period 14 is above 50 levels with the signal lines pointing down to indicate a sell signal. Increase in the sellers’ momentum will push the Binance Coin below the support level of $503 and if the daily candlestick close below it, then, the price may decrease further to test the $420 and $364 support level. Failure to break down the support level of $503 by the bears will increase the price to the resistance levels at $599, $663, and $758.
BNBUSD medium-term Trend: Bearish
BNBUSD is bearish in the 4-hour chart. The resistance level of $599 was tested on 12 April, the Binance coin bounces back due to weak bullish momentum. The price descends and penetrates the support level at $503 and it is moving towards the support level of $420.
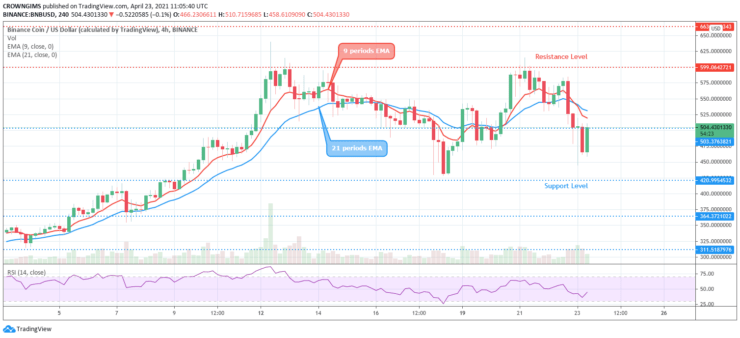
The price is currently retesting the broken level. The price has penetrated 9 periods EMA and 21 periods EMA downside while the coin is trading below the two EMAs which connotes an increase in the bears’ momentum.
- Broker
- Min Deposit
- Score
- Visit Broker

- Award-winning Cryptocurrency trading platform
- $100 minimum deposit,
- FCA & Cysec regulated

- 20% welcome bonus of upto $10,000
- Minimum deposit $100
- Verify your account before the bonus is credited
- Fund Moneta Markets account with a minimum of $250
- Opt in using the form to claim your 50% deposit bonus
Learn to Trade
Never Miss A Trade Again

Signal Notification
Real-time signal notifications whenever a signal is opened, closes or Updated

Get Alerts
Immediate alerts to your email and mobile phone.

Entry Price Levels
Entry price level for every signal Just choose one of our Top Brokers in the list above to get all this free.