Don’t invest unless you’re prepared to lose all the money you invest. This is a high-risk investment and you are unlikely to be protected if something goes wrong. Take 2 minutes to learn more
Price movement in the Tamadoge market has been recovering impressively from the previous downward correction. At this point, price action has moved past critical technical levels. Therefore, buyers may be looking forward to seeing the market progress further upwards.
The previous price candle on the TAMA/USDT 4-hour chart has shown a notable recovery, pushing through the ceiling formed by the 9-day Exponential Moving Average (EMA) line.
Although the last price candle produced a downward retracement, price action remains well supported above the 9-day EMA curve. Similarly, the Stochastic Relative Strength Index (SRSI) indicator lines are rising from the oversold region.
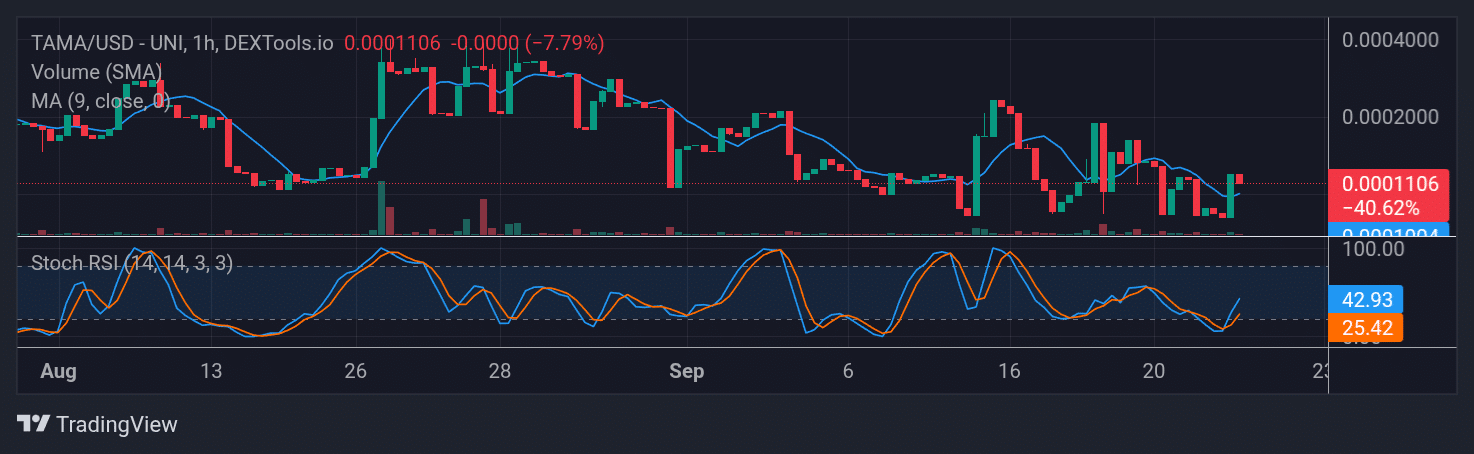
The Tamadoge market on the 1-hour price chart reveals that upside forces continue to show a generally positive outlook. The last price candle on this chart also appears red but stays above the 9-day EMA curve.
The SRSI line is tilting upward, indicating the overall trend in the market. Likewise, the SRSI lines are trending upwards following an upside crossover below the 20 mark of the indicator. Therefore, bullish forces are maintaining dominance, and the market may advance higher toward the $0.0001500 price level. Also, you can still climb higher on the weekly leaderboards and stack up on $TAMA rewards as you battle your way to the top!
Fill your weekend by playing five exhilarating play-to-earn arcade games! 🕹️💰
Battle your way to the top of the weekly leaderboards and load up on $TAMA rewards!
Trade on MT4 with Leverage up to 1:500! Trade on MT4 with Leverage up to 1:500!
X
We use cookies to ensure that we give you the best experience on our website. If you continue to use this site we will assume that you are happy with it.
 .0001000 Resistance" width="1474" height="474" data-lazy-src="https://learn2.trade/wp-content/uploads/2025/09/TAMA_USD-UNI_2025-09-22_16-12-12.png"/>
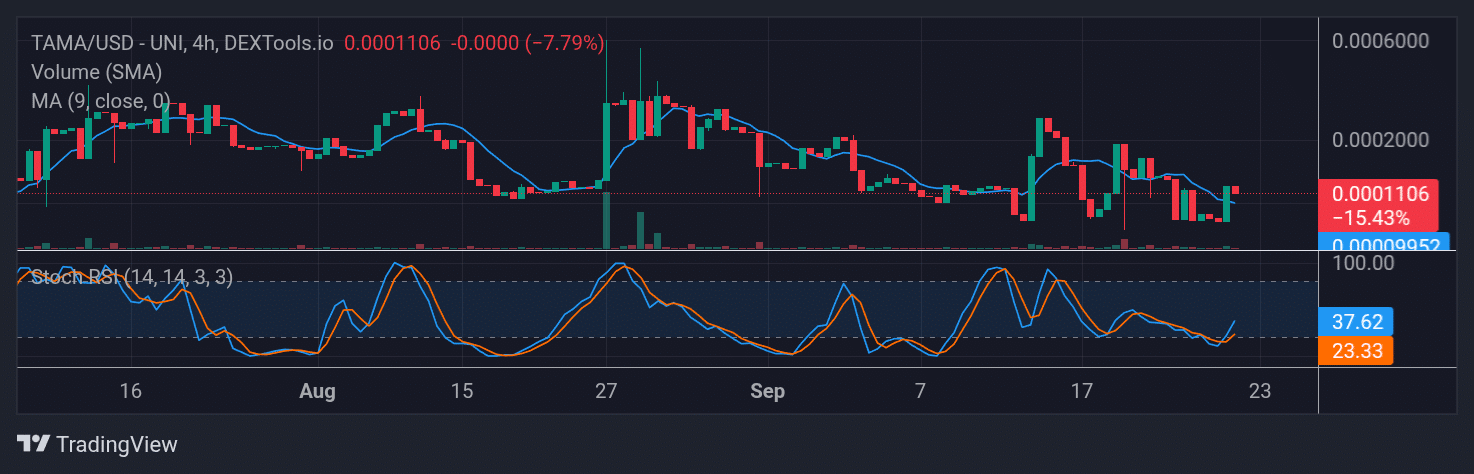
 .0001000 Resistance" width="1474" height="454" data-lazy-src="https://learn2.trade/wp-content/uploads/2025/09/TAMA_USD-UNI_2025-09-22_16-13-03.png"/>