Don’t invest unless you’re prepared to lose all the money you invest. This is a high-risk investment and you are unlikely to be protected if something goes wrong. Take 2 minutes to learn more
Trading activity in the Tamadoge market has resumed above the $0.001000 threshold. Additionally, volatility has spiked, helping the market quickly through multiple resistance levels. Yet, this market still has a fair chance of reaching even higher price levels as trading continues.
Key TAMA Statistics on September 2, 2024:
TAMA’s Price: $0.001305
Tamadoge Market Capitalization: $1,743,988
TAMA’s Circulating Supply: 1,417,967,396
TAMA’s Total Supply: 2,000,000,000
Tamadoge’s Rank on CoinMarketCap: 1564
.001000 Threshold" width="580" height="308" data-lazy-src="https://learn2.trade/wp-content/uploads/2024/09/TAMAUSDT_2024-09-02_18-56-19_065831-1024x543.png"/>
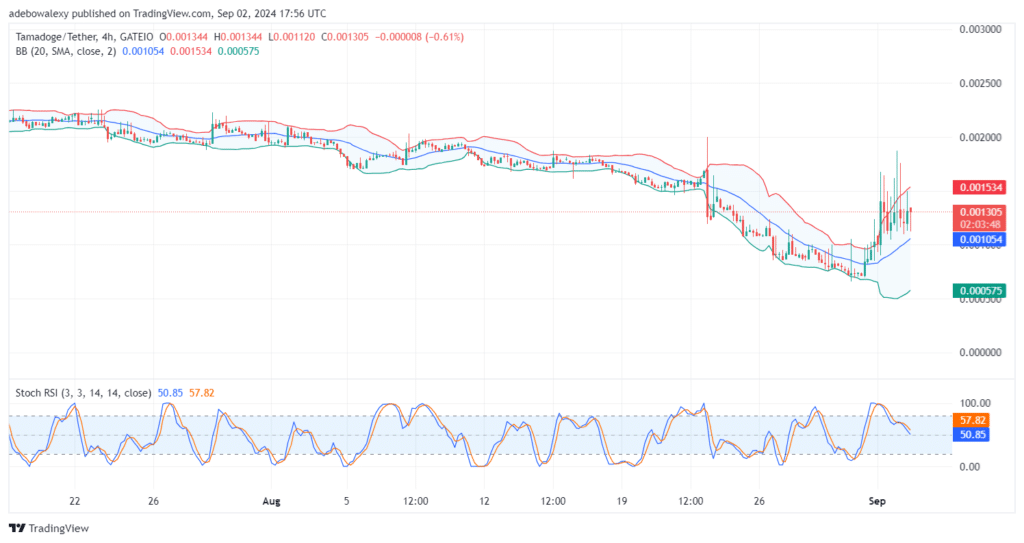
TAMA/USDT Still Has the Potential to Reach Higher Levels
Price action in the Tamadoge market has come a long way from lower price levels. Previously, the market had bottomed out near the $0.000700 threshold. However, the market regained bullish momentum, which propelled it through multiple resistance levels, and appears to still have what it takes to go higher.
The applied Bollinger Bands (BB) indicator shows an upward trajectory and indicates a spike in price volatility, evident from the widening of the upper and lower bands of the indicator. Additionally, price action can still be seen dwelling above the BB indicator’s middle limit. This suggests that price action may continue to extend upwards, despite the trajectory of the Stochastic Relative Strength Index (Stochastic RSI) indicator.
.001000 Threshold" width="580" height="308" data-lazy-src="https://learn2.trade/wp-content/uploads/2024/09/TAMAUSDT_2024-09-02_18-56-34_065840-1024x543.png"/>
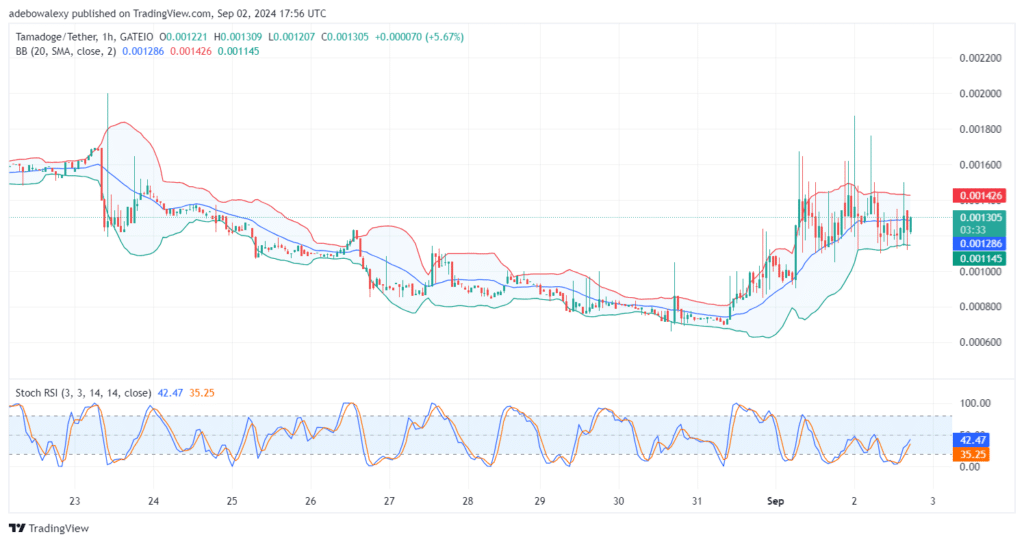
The Tamadoge Market Picks a New Target
Price movement in the TAMA/USDT 1-hour market suggests that the market is already aiming higher. Here, the last price candle appears solid green, placing the token’s price back above the middle limit of the Bollinger Bands indicator. The appearance of prices above the middle limit suggests that upward forces are gaining more ground to secure bullish momentum.
Additionally, the Stochastic RSI indicator lines are rising from the oversold region of the indicator. The trajectory of the Stochastic RSI lines suggests that traders in the market may want to use more crypto signals targeting the $0.001500 mark and higher. Furthermore, you can compete for the top spot on the leaderboard with $TAMA fans from around the globe!
Who wants to play #Tamadoge Arcade on mobile?! ✋ 👾
Feast yourself with 5 action-packed games. 🎮
Battle it out for the top spot on the leaderboard with $TAMA fans across the world! 🌎
Trade on MT4 with Leverage up to 1:500! Trade on MT4 with Leverage up to 1:500!
X
We use cookies to ensure that we give you the best experience on our website. If you continue to use this site we will assume that you are happy with it.
 .001000 Threshold" width="580" height="308" data-lazy-src="https://learn2.trade/wp-content/uploads/2024/09/TAMAUSDT_2024-09-02_18-56-19_065831-1024x543.png"/>