Don’t invest unless you’re prepared to lose all the money you invest. This is a high-risk investment and you are unlikely to be protected if something goes wrong. Take 2 minutes to learn more
Bulls in the Tamadoge market have continued to gain more traction. As a result, the market is advancing towards elevated price levels in a steady manner. In fact, price activity in the market has surpassed technical barriers as the trend seems ready to continue.
Key TAMA Statistics on October 12, 2024:
TAMA Price: $0.000968
Tamadoge Market Capitalization: $1.356
TAMA Circulating Supply: 1,417,967,390
Total Supply: 2,000,000,000
Tamadoge CoinMarketCap Rank: 1726
.001000 Mark" width="580" height="300" data-lazy-src="https://learn2.trade/wp-content/uploads/2024/10/TAMAUSDT_2024-10-12_09-10-36_030828-1024x530.png"/>
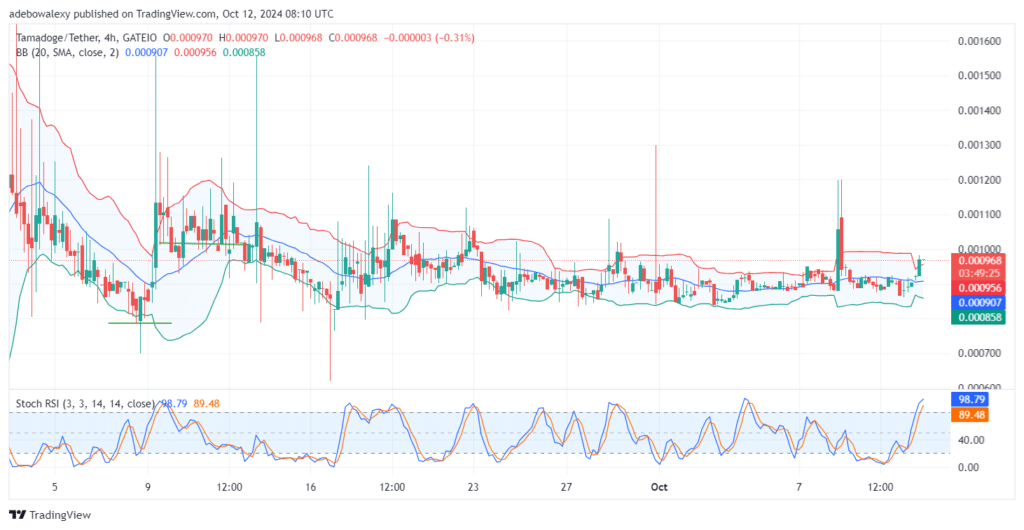
TAMA/USDT Market Bursts Through an Important Resistance
Trading activity in the Tamadoge market today has surged. As a result, the last price candle on the price chart is positioned outside the uppermost Bollinger Bands. Additionally, a careful examination of the Bollinger Bands indicator reveals that the indicator is hinting at a bullish explosion through its widening bands.
Meanwhile, the Stochastic RSI lines are still trending upwards and higher into the overbought region. There is some distance between the leading and lagging lines of the indicator, suggesting that the market is fairly volatile. This could help the market break through the next technical resistance level if bulls maintain their composure.
.001000 Mark" width="580" height="300" data-lazy-src="https://learn2.trade/wp-content/uploads/2024/10/TAMAUSDT_2024-10-12_09-11-02_030826-1024x530.png"/>
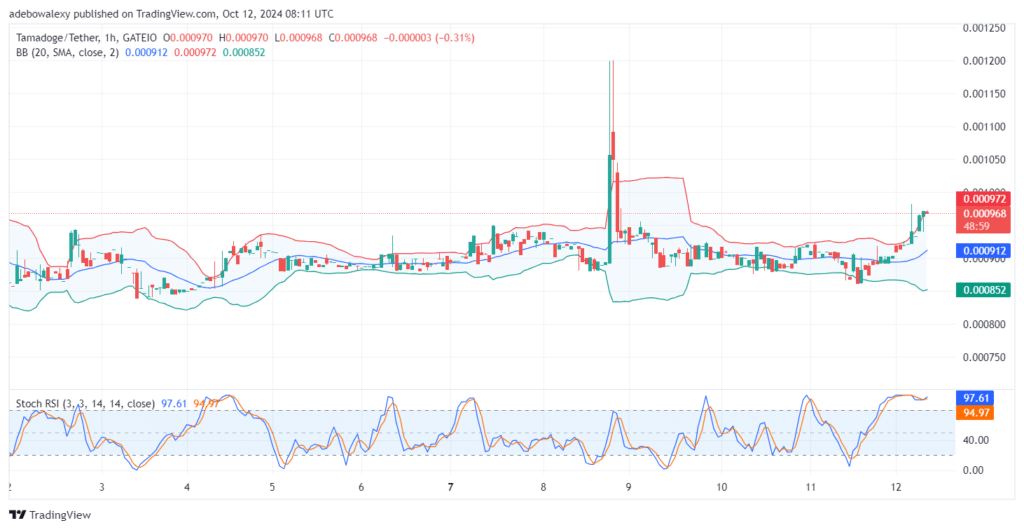
Tamadoge Price Action Continues to Hover at High Levels
Similar to what is seen on the TAMA/USDT 4-hour chart, the price activity continues to maintain a bullish trajectory. This consistency suggests that market participants are fairly aligned on sentiment. Consequently, the last red price candle can be seen outside the uppermost limit of the Bollinger Bands indicator.
Furthermore, the Stochastic RSI indicator lines show an upside crossover in the overbought region. These lines are continuing to rise, indicating that upward momentum may push the price further, maintaining the usefulness of crypto signals targeting at least the $0.001000 price level. At the same time, you can climb the weekly leaderboards and stack up on $TAMA rewards as you battle your way to the top!
Fill your weekend by playing five exhilarating play-to-earn arcade games! 🕹️💰
Battle your way to the top of the weekly leaderboards and load up on $TAMA rewards!
Trade on MT4 with Leverage up to 1:500! Trade on MT4 with Leverage up to 1:500!
X
We use cookies to ensure that we give you the best experience on our website. If you continue to use this site we will assume that you are happy with it.
 .001000 Mark" width="580" height="300" data-lazy-src="https://learn2.trade/wp-content/uploads/2024/10/TAMAUSDT_2024-10-12_09-10-36_030828-1024x530.png"/>