Don’t invest unless you’re prepared to lose all the money you invest. This is a high-risk investment and you are unlikely to be protected if something goes wrong. Take 2 minutes to learn more
Upside forces in the Tamadoge market have responded positively to headwind aggression. This can be seen as price action refusing to dip below the $0.002500 price level. Instead, upside forces have made a noticeable impact by pushing the market upwards.
Key TAMA Statistics on June 21, 2024:
TAMA’s Price: $0.002660
Tamadoge Market Capitalization: $3,705,478
TAMA’s Circulating Supply: 1,393,353,219
TAMA’s Total Supply: 1,417,967,396
Tamadoge’s Rank on CoinMarketCap: 1384
Key Price Levels:
Resistance: $0.003000, $0.004000, and $0.004500
Support: $0.002500, $0.002000, and $0.001500
.002500 Threshold" width="580" height="306" data-lazy-src="https://learn2.trade/wp-content/uploads/2024/06/TAMAUSDT_2024-06-21_14-03-37_020455-1024x541.png"/>
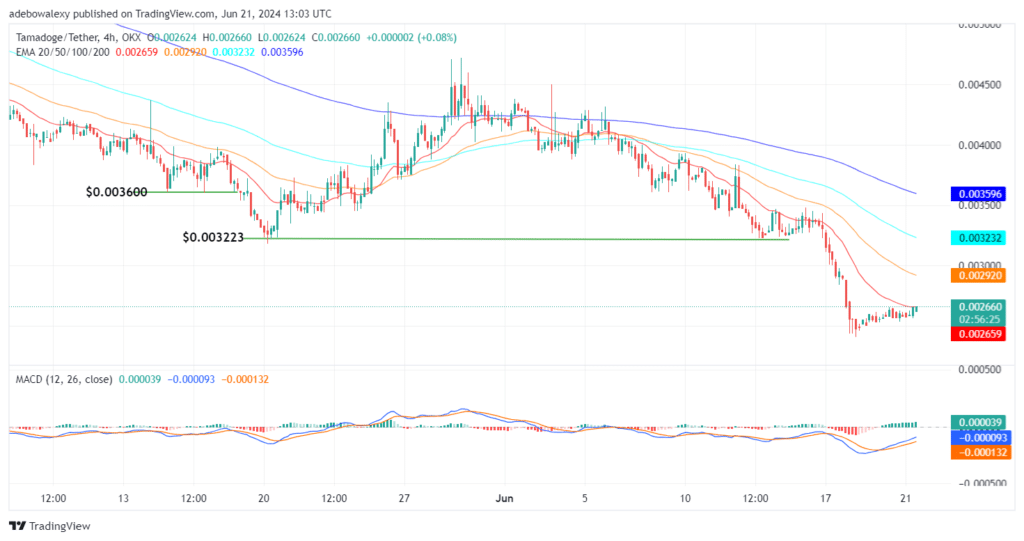
TAMA/USDT Price Action Stays on Course, Aiming to Rise Past the 20-Day EMA Curve
Price action in the Tamadoge 4-hour market rebounded upwards several sessions ago. However, upside forces didn’t have the momentum needed to secure considerable upside progress then. Nevertheless, it appears they have eventually found the push they need to progress upwards at this point. The last two price candles on the chart show that volatility is returning to price action, as they now appear more conspicuous and bullish.
Meanwhile, the Moving Average Convergence Divergence (MACD) lines are still rising steadily towards the equilibrium level. Likewise, green bars continue to appear above the equilibrium level on the MACD indicator. This suggests that price action may rise past the 20-day Exponential Moving Average curve. Consequently, this will increase the relevance of bullish crypto signals in this market.
.002500 Threshold" width="580" height="306" data-lazy-src="https://learn2.trade/wp-content/uploads/2024/06/TAMAUSDT_2024-06-21_14-04-00_020453-1024x541.png"/>
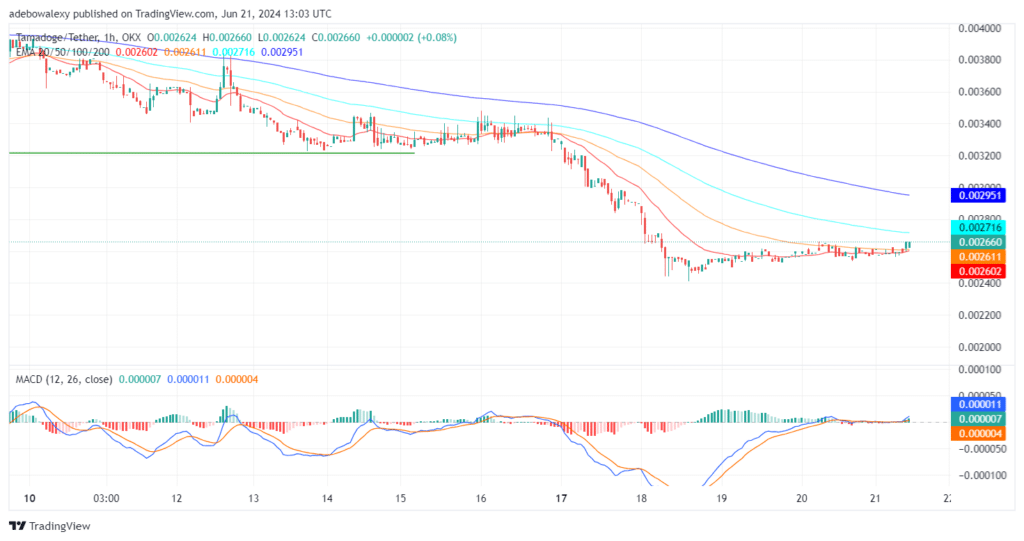
Tailwind Is Building Up in the Tamadoge Market
While upside hopes can be seen in the TAMAUSDT market from the 4-hour chart, the 1-hour market has further revealed the dynamics at play. Here, the last two price candles can be seen above the 20- and 50-day EMA lines. The last price candle can be seen keeping the market at the same level as it was in the previous session. This shows that the market is facing an initial barrier. Nevertheless, we can see that the 20- and 50-day EMA lines are now converged below these two price candles.
This suggests that price movement may now receive the upside push required to break that barrier. This will eventually lead to price action rising through the 100-day EMA line, thus securing more upside potential. Likewise, the MACD lines are now above the equilibrium level and are trending upward. Therefore, it appears that the market is headed towards the $0.003000 mark. Meanwhile, you can ascend the Tamadoge leaderboards and score major victories in the Tamaverse!
🔥 Thursday Competition Restarts! 🔥
Get ready to climb the leaderboards and win BIG in the Tamaverse! 🌟
1. Enter the game 👾 2. Post a high score 🕹️ 3. The higher your score, the bigger your share of the $TAMA prize pool! 💰
Trade on MT4 with Leverage up to 1:500! Trade on MT4 with Leverage up to 1:500!
X
We use cookies to ensure that we give you the best experience on our website. If you continue to use this site we will assume that you are happy with it.
 .002500 Threshold" width="580" height="306" data-lazy-src="https://learn2.trade/wp-content/uploads/2024/06/TAMAUSDT_2024-06-21_14-03-37_020455-1024x541.png"/>