Don’t invest unless you’re prepared to lose all the money you invest. This is a high-risk investment and you are unlikely to be protected if something goes wrong. Take 2 minutes to learn more
Price activity in the Tamadoge market has held steady around the $0.002200 mark. It was earlier thought that the market might soon break that resistance price level; however, the market couldn’t do so in the previous session. A new session has begun, and buyers are already in the lead, signaling that price action may progress further.
Key TAMA Statistics on July 16, 2024:
TAMA’s Price: $0.002186
Tamadoge Market Capitalization: $3,006,408
TAMA’s Circulating Supply: 1,393,353,219
TAMA’s Total Supply: 1,417,967,396
Tamadoge’s Rank on CoinMarketCap: 1433
Key Price Levels:
Resistance: $0.002400, $0.002800, and $0.003300
Support: $0.002000, $0.001600, and $0.001200
.002200 Mark" width="580" height="308" data-lazy-src="https://learn2.trade/wp-content/uploads/2024/07/TAMAUSDT_2024-07-16_02-20-01_022153-1024x543.png"/>
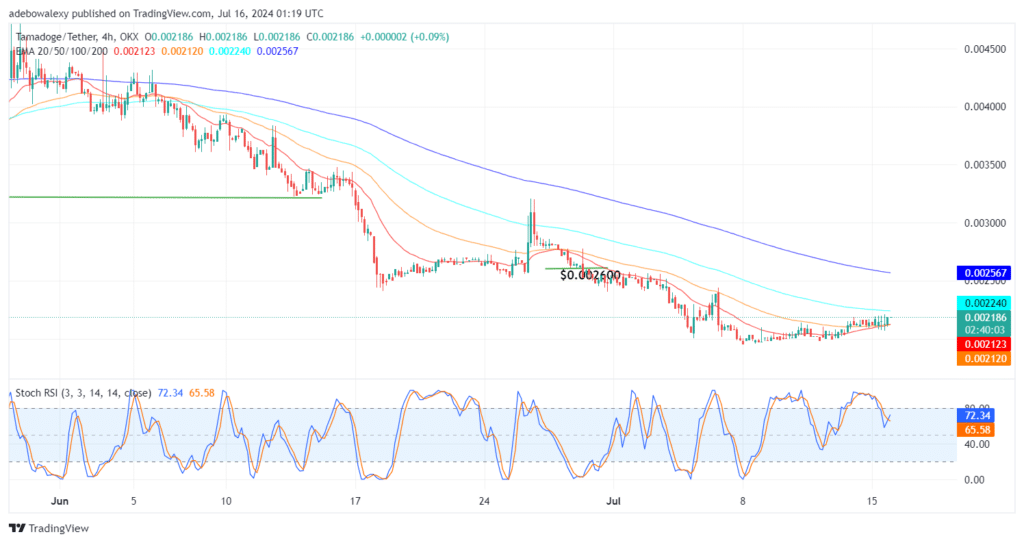
TAMA/USDT Bulls Appear Ready to Continue Leading
The previous session ended in the Tamadoge market, with buyers retaining a significant part of their gains. This keeps the market very close to technical resistance at the $0.002200 mark. The last price candle for the session can be seen appearing above the 20- and 50-day Exponential Moving Average (EMA) lines.
Likewise, the Stochastic Relative Strength Index (SRSI) lines can be seen delivering a bullish crossover above the 50 mark of the indicator. Consequently, this shows that upside forces are on the right track toward pushing price action higher as trading activity continues.
.002200 Mark" width="580" height="308" data-lazy-src="https://learn2.trade/wp-content/uploads/2024/07/TAMAUSDT_2024-07-16_02-20-26_022151-1024x543.png"/>
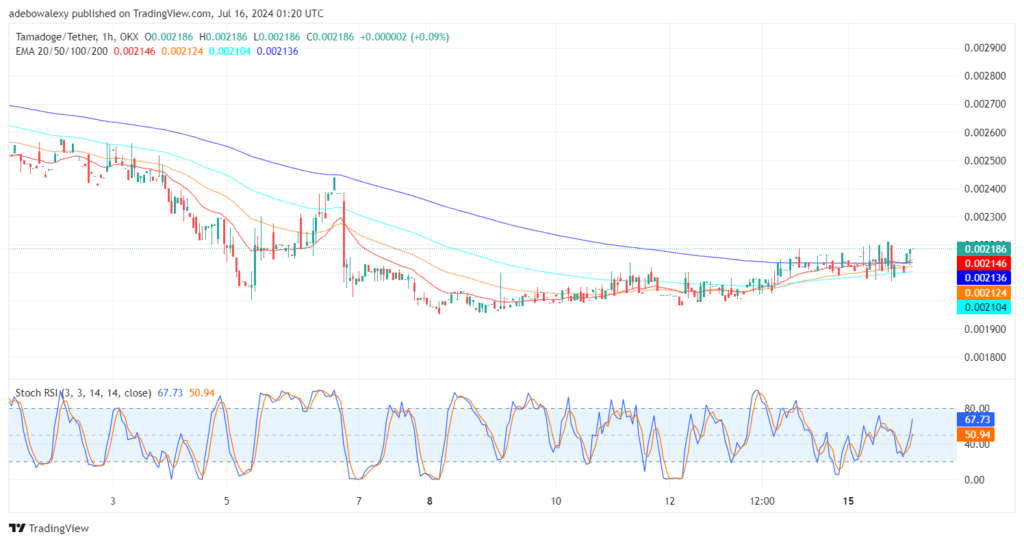
Tamadoge Market Stays in Favor of a Continued Upward Correction
The TAMA/USDT market has continued to progress upwards above a strong baseline. This baseline is formed by the converging lines of the Exponential Moving Average indicator. The last price candle on this chart resembles a dash price candle. Although this shows that there has been very little movement in the ongoing session, the base of the recent price candle suggests that this market has upside potential.
Likewise, the SRSI indicator lines rise steeply upwards towards the oversold region. Therefore, traders might want to enter the market with bullish crypto signals since it appears the market may head towards the $0.002300 or $0.002400 mark. Also, you can kick off your week with #Tamadoge at no cost! Claim your own puppy #NFT at no charge and receive $TAMA rewards for outstanding pet care.
Trade on MT4 with Leverage up to 1:500! Trade on MT4 with Leverage up to 1:500!
X
We use cookies to ensure that we give you the best experience on our website. If you continue to use this site we will assume that you are happy with it.
 .002200 Mark" width="580" height="308" data-lazy-src="https://learn2.trade/wp-content/uploads/2024/07/TAMAUSDT_2024-07-16_02-20-01_022153-1024x543.png"/>