Don’t invest unless you’re prepared to lose all the money you invest. This is a high-risk investment and you are unlikely to be protected if something goes wrong. Take 2 minutes to learn more
In a movement that appears to correlate with Bitcoin, the Tamadoge market has been gaining upward momentum in recent trading sessions. The market has surpassed some critical landmarks on technical indicators, which may provide further upside momentum.
Key TAMA Statistics on July 14, 2024:
TAMA’s Price: $0.002136
Tamadoge Market Capitalization: $2,965,883
TAMA’s Circulating Supply: 1,393,353,219
TAMA’s Total Supply: 1,417,967,396
Tamadoge’s Rank on CoinMarketCap: 1422
Key Price Levels:
Resistance: $0.002400, $0.002800, and $0.003200
Support: $0.002000, $0.001600, and $0.001200
.002100 Price Level" width="580" height="308" data-lazy-src="https://learn2.trade/wp-content/uploads/2024/07/TAMAUSDT_2024-07-14_06-08-28_063730-1024x543.png"/>
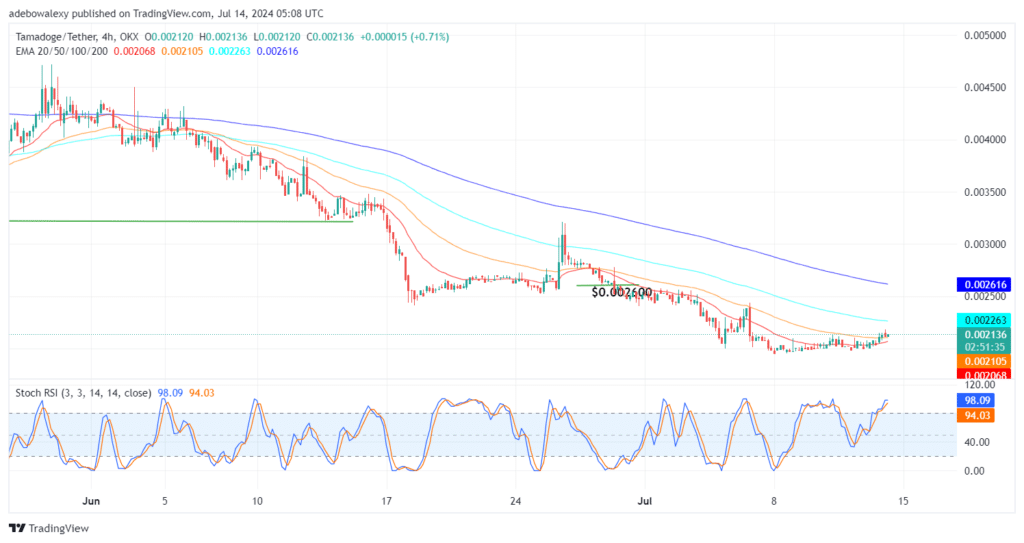
TAMA/USDT Market May Have Acquired New Support Above the 50-Day EMA
Tamadoge’s price action broke through the 50-day Exponential Moving Average (EMA) lines in the past three sessions. Now, price movement suggests that the market may have found support just above that indicator line. The current session on the 4-hour chart appears bullish and has returned the market to an upward path following the minimal downward correction seen in the previous session.
Meanwhile, the Stochastic Relative Strength Index (SRSI) lines maintain a general upward trajectory despite the deflection on the indicator’s leading line. This suggests that market participants might still want to use bullish crypto signals in subsequent sessions.
.002100 Price Level" width="580" height="308" data-lazy-src="https://learn2.trade/wp-content/uploads/2024/07/TAMAUSDT_2024-07-14_06-08-50_063726-1024x543.png"/>
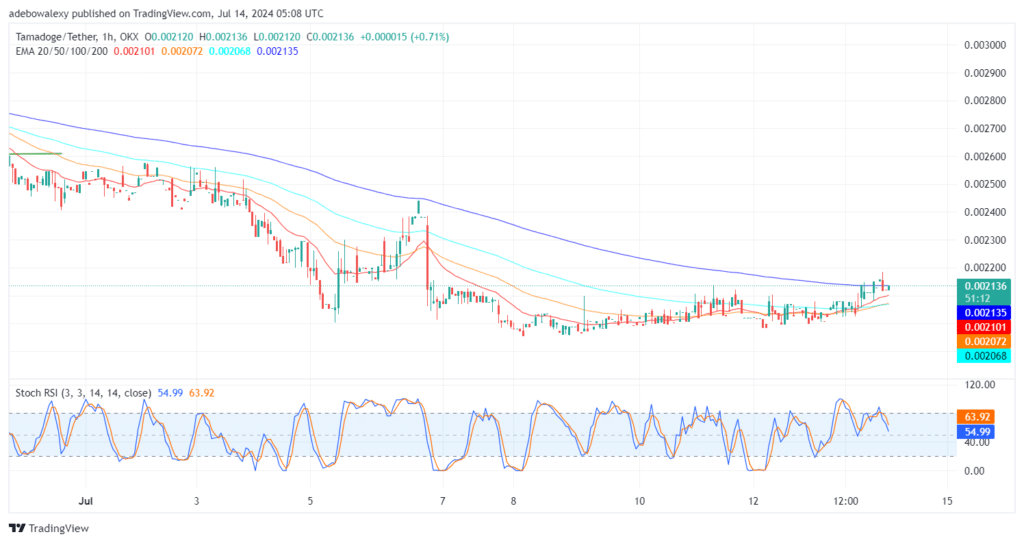
The Tamadoge Market Prepares to Surpass the 200-Day EMA
Extending the TAMA/USDT price analysis to a 1-hour timeframe, we can see that price action is about to break the resistance formed by the 200-day EMA curve. It is worth noting that price action has been hovering around this indicator line recently. However, the SRSI indicator lines are still trending downward toward the 50 mark of the indicator.
Nevertheless, the lines are now closer to each other, indicating that the direction of the indicator may soon change due to bullish activity in this market. Therefore, traders may want to set their targets at the $0.002500 mark for short-term gains. Also, the Tamadoge P2E experience revolves around three main aspects: play, earn, and stake.
Trade on MT4 with Leverage up to 1:500! Trade on MT4 with Leverage up to 1:500!
X
We use cookies to ensure that we give you the best experience on our website. If you continue to use this site we will assume that you are happy with it.
 .002100 Price Level" width="580" height="308" data-lazy-src="https://learn2.trade/wp-content/uploads/2024/07/TAMAUSDT_2024-07-14_06-08-28_063730-1024x543.png"/>