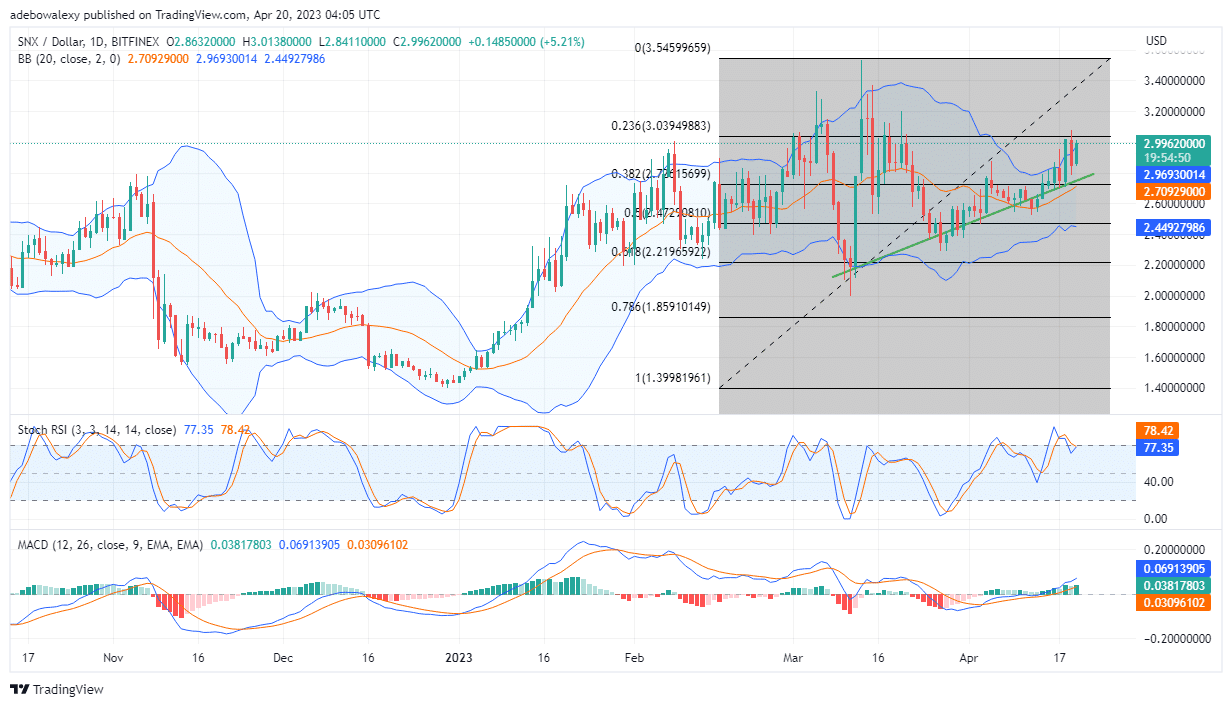
Price activity in the SNXUSD Mark shook off the downward retracement that occurred in the previous trading session after price action pushed the upper limit of the Bollinger Bands indicator. At this point, this crypto has recouped some upside traction and seems set for more.
Synthetix Analysis Data
SNX Value Now: $2.99
SNX Protocol Market Cap: $767,310,696
Synthetix Moving Supply: 258,348,521
Synthetix Total Supply: 317,323,241
SNX CoinMarketCap Ranking: 63
Major Price Levels:
Top: $2.99, $3.29, and $3.60
Base: $2.90, $2.70, and $2.50

Synthetix (SNX) Regains Bullish Traction
The last price candle on the SNXUSD daily chart shows that buyers have re-entered the market after some short orders were triggered and the price retraced downwards. As of now, the current price of this cryptocurrency surpasses the uppermost limit of the Bollinger Bands indicator. Consequently, this portrays the bullish nature of price action in this market. Trading indicators are suggesting that price activities may advance towards higher price marks. The Relative Strength Index (RSI) has yet to gain, giving another bullish crossover in the overbought zone. Meanwhile, the MACD curves are progressing above the 0.00 mark, with a green bar appearing on this indicator. Consequently, this suggests that upside momentum is strong in this market and that more upside levels may be covered.

Synthetix (SNX) Starts a New Session on a Good Note
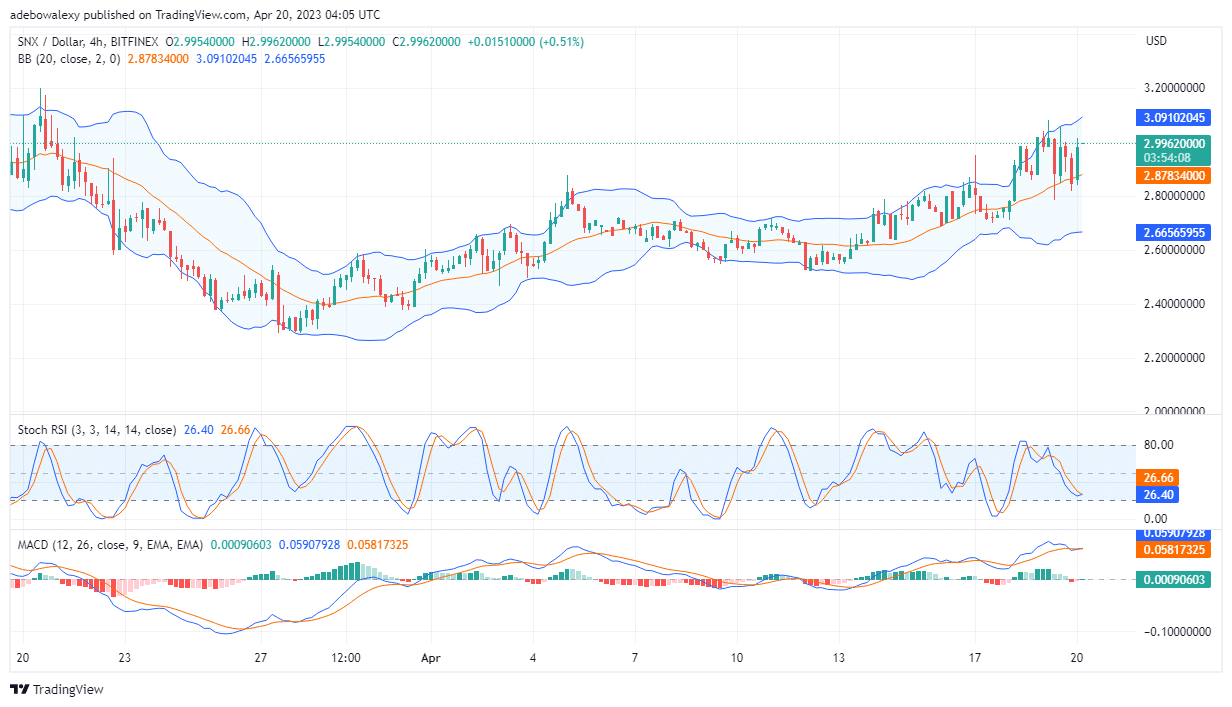
Looking at the SNXUSD 4-hour market, it can be seen that a new session has begun in favor of buyers. A dashed green price candle can be seen appearing a bit above the previous bullish price candle. Meanwhile, technical indicators are also showing positive indications about further price increases. An upside crossover can be seen on the Stochastic RSI indicator. And, at the same time, the curves of the MACD indicator have risen above the equilibrium level. However, traders should note that a red histogram bar has just appeared below the equilibrium level of the MACD indicator. Consequently, this may be pointing to the fact that traders are once again going short. Therefore, as much as traders may anticipate the price moving towards the 3.100 level, a stop could be placed at the midway level of the present price candle.
- Broker
- Min Deposit
- Score
- Visit Broker
- Award-winning Cryptocurrency trading platform
- $100 minimum deposit,
- FCA & Cysec regulated
- 20% welcome bonus of upto $10,000
- Minimum deposit $100
- Verify your account before the bonus is credited
- Fund Moneta Markets account with a minimum of $250
- Opt in using the form to claim your 50% deposit bonus
Learn to Trade
Never Miss A Trade Again

Signal Notification
Real-time signal notifications whenever a signal is opened, closes or Updated

Get Alerts
Immediate alerts to your email and mobile phone.

Entry Price Levels
Entry price level for every signal Just choose one of our Top Brokers in the list above to get all this free.


