

SUI Price Forecast: February 5
The SUI price forecast suggests that the market is at a decisive point at $3.2845. Bulls could use this level as a foundation for further gains, but a break below it would shift momentum in favor of the bears.
SUI Long-Term Trend: Ranging (1-Day Chart)
Key Levels:
Resistance Levels: $5.3640, $4.3000, $3.9660
Support Levels: $3.2845, $2.3854, $1.7629 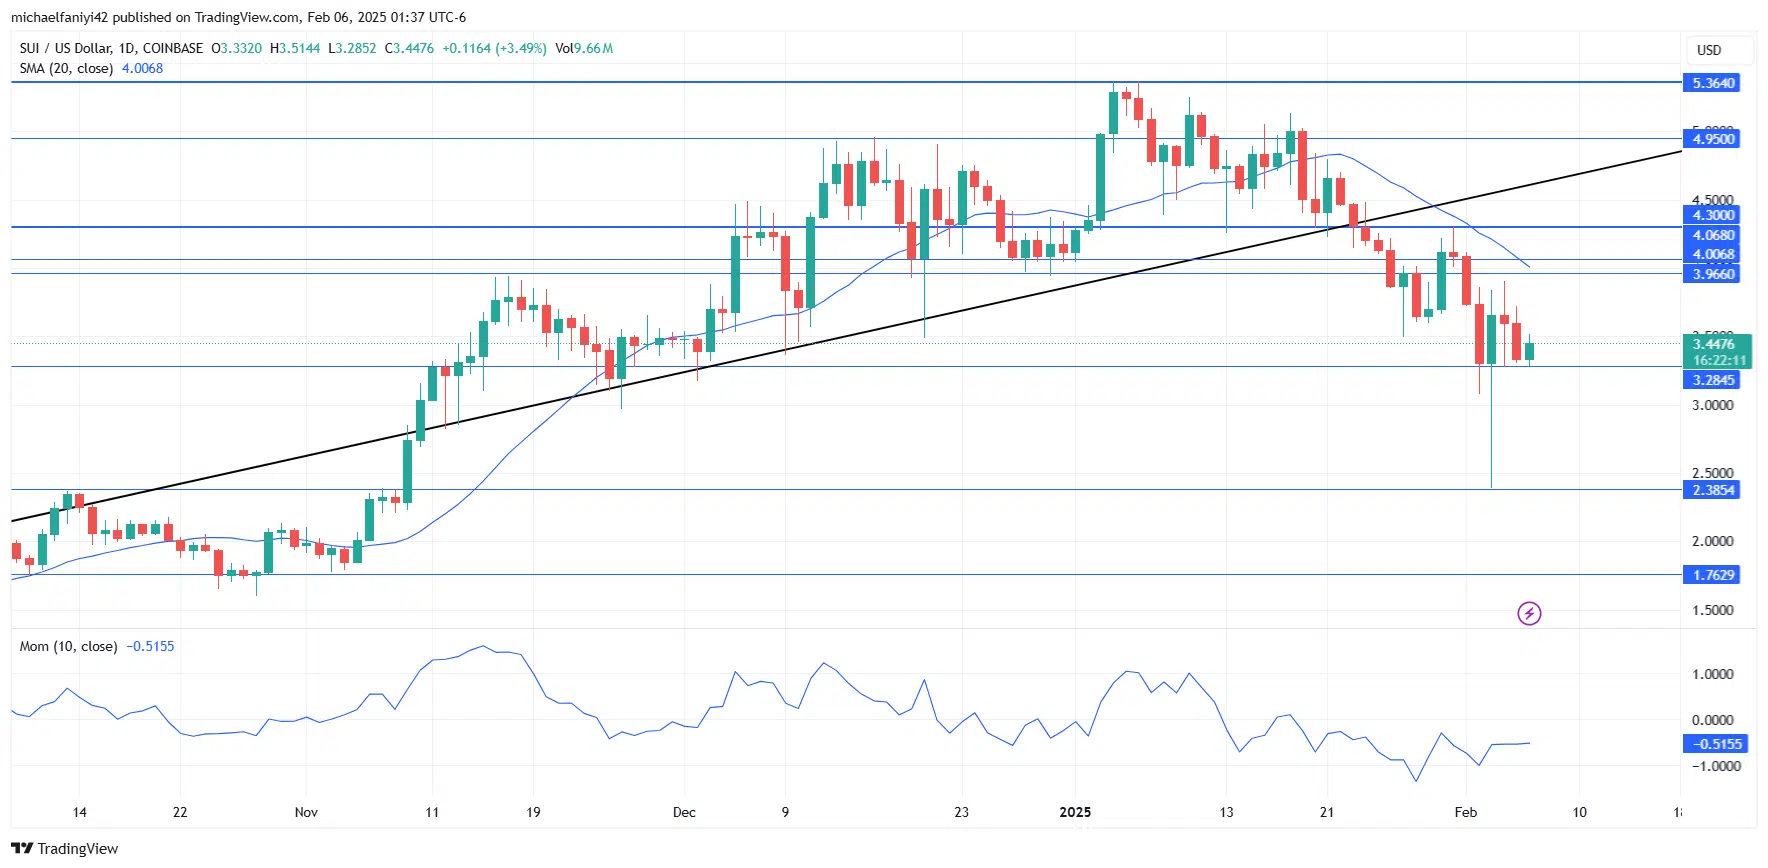
SUI Price Forecast: SUI/USD Outlook
The $3.2845 key level plays a vital role in the market. It previously acted as a support point, stabilizing the price surge from $1.7630 in November before the coin continued its ascent.
When the price fell below the rising trendline, it initially halted at $1.7630 before bearish pressure drove it even lower. The Moving Average (MA) Period 20 is currently positioned above the daily candles, reflecting the impact of the decline from $4.3000.
The Momentum indicator first turned negative after the rejection at $5.3640 and has remained in negative territory. However, the recent price increase is beginning to push it higher.
SUI Medium-Term Trend: Bullish (4-Hour Chart)
After climbing above $3.2845, the market has started testing resistance at $3.9660. The MA Period 20 is positioned above the current price, indicating that the bulls have regained some ground. 
Make money without lifting your fingers: Start using a world-class auto trading solution
How To Buy Lucky Block
Note: Learn2.trade is not a financial advisor. Do your research before investing your funds in any financial asset, product, or event. We are not responsible for your investment results.


