STELLAR Price Analysis – March 16
When the bulls increase their pressure, price may break up $0.20 level and increase towards the resistance level of $0.25 and $0.30. An increase in the sellers’ pressure may breakdown the support level of $0.18 which may decrease the price to the support level at $0.11 and $0.09. The relative strength index period 14 is at 45 level displaying no specific market direction.
XLM/USD Market
Key Levels:
Resistance levels: $0.20, $0.25, $0.30
Support levels: $0.18, $0.11, $0.09
XLM/USD Long-term Trend: Ranging
Stellar is ranging on the daily chart. The bearish momentum that started after the formation of double top chart pattern has decreased the price to the support level of $0.18. The mentioned level holds and the price is consolidating within the resistance level of $0.20 and support level of $0.18. At the moment, it seems the bearish pressure is becoming weak and the bulls’ momentum is also weak. Price may continue consolidating until there is a breakout.
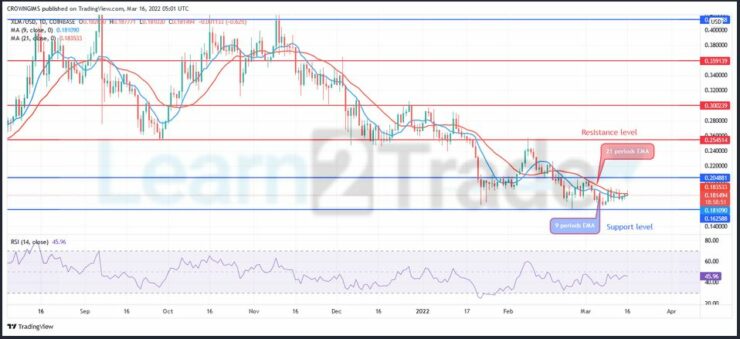
The price is over and around the 9 periods EMA and 21 periods EMA as a sign of a ranging market. When the bulls increase their pressure, price may break up $0.20 level and increase towards the resistance level of $0.25 and $0.30. An increase in the sellers’ pressure may breakdown the support level of $0.18 which may decrease the price to the support level at $0.11 and $0.09. The relative strength index period 14 is at 45 level displaying no specific market direction.
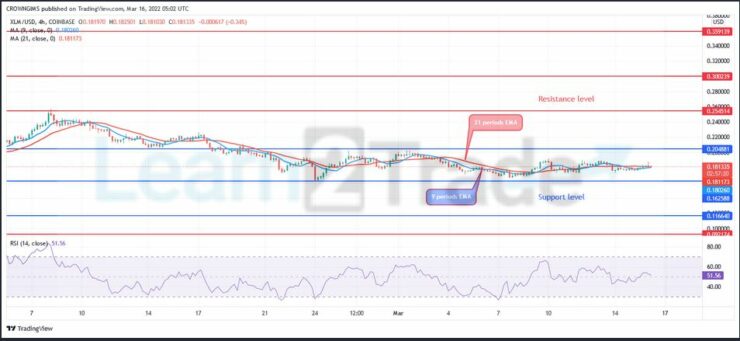
XLM/USD Medium-term Trend: Ranging
Stellar is on the ranging movement in the 4-hour chart. The coin was on the consolidation movement last two week. The movement was closed to the support level of $0.20. Last week, the bears gained upper hand over the bulls and the price is decreased towards the support level of $0.18.
You can purchase Lucky Block – Guide, Tips & Insights | Learn 2 Trade here. Buy LBlock:
- Broker
- Min Deposit
- Score
- Visit Broker

- Award-winning Cryptocurrency trading platform
- $100 minimum deposit,
- FCA & Cysec regulated

- 20% welcome bonus of upto $10,000
- Minimum deposit $100
- Verify your account before the bonus is credited
- Fund Moneta Markets account with a minimum of $250
- Opt in using the form to claim your 50% deposit bonus
Learn to Trade
Never Miss A Trade Again

Signal Notification
Real-time signal notifications whenever a signal is opened, closes or Updated

Get Alerts
Immediate alerts to your email and mobile phone.

Entry Price Levels
Entry price level for every signal Just choose one of our Top Brokers in the list above to get all this free.