STELLAR Price Analysis – September 08
In case the bears are able to push the price below the support level of $0.30 and the daily candle closes below it, then, Stellar price may reduce to the previous low of $0.19 levels. If the buyers defend the support level of $0.30, price may continue its bullish trend towards the resistance levels of $0.42, $0.48 and $0.55.
XLM/USD Market
Key Levels:
Resistance levels: $0.42, $0.48, $0.55
Support levels: $0.30, $0.24, $0.19
XLM/USD Long-term Trend: Bullish
Stellar is bullish on the daily chart. Stellar was being controlled by the bears last two weeks. The bearish movement was interrupted by the bulls at the $0.35 level. The bulls’ strength increased with the formation of more bullish candles. The price increases towards the resistance level of $0.42. On 07 September, sellers defended the resistance level of $0.42 and increased their momentum with the formation of strong big daily bearish candle which make the price to retest the support level of $0.30.
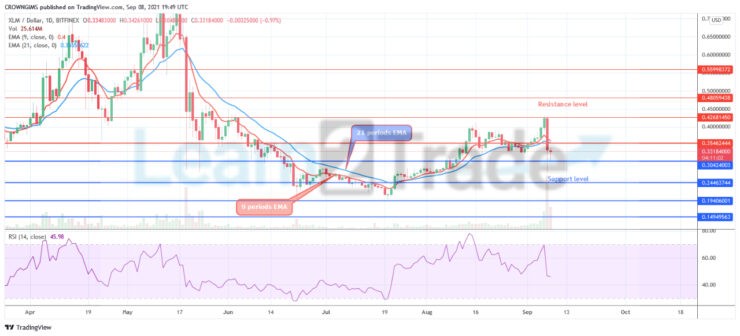
Stellar breaks down the dynamic support levels. Stellar is trading below the 9 periods EMA and 21 periods EMA, this may be a pullback. In case the bears are able to push the price below the support level of $0.30 and the daily candle closes below it, then, Stellar price may reduce to the previous low of $0.19 levels. If the buyers defend the support level of $0.30, price may continue its bullish trend towards the resistance levels of $0.42, $0.48 and $0.55.
XLM/USD Medium-term Trend: Bearish
Stellar is on the bearish movement on the 4-hour chart. The bulls pushed up the price to test the resistance level of $0.42 on 06 September. An evening star candle pattern formed at the mentioned level and the price obeyed this bearish candle pattern. The price decline and break down the $0.35 level. The support level of $0.30 is tested and it is repelling from the level at the moment.
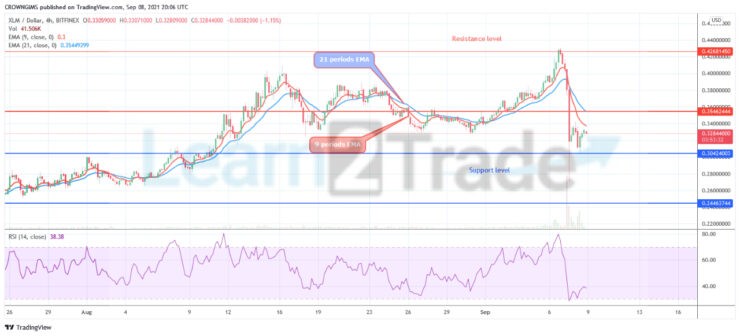
Stellar is trading below 9 periods EMA and 21 periods EMA as a sign of bearish market. The Relative Strength Index periods 14 is at 40 levels and the signal line pointing up to indicate a buy signal.
You can purchase crypto coins here. Buy Tokens
- Broker
- Min Deposit
- Score
- Visit Broker

- Award-winning Cryptocurrency trading platform
- $100 minimum deposit,
- FCA & Cysec regulated

- 20% welcome bonus of upto $10,000
- Minimum deposit $100
- Verify your account before the bonus is credited
- Fund Moneta Markets account with a minimum of $250
- Opt in using the form to claim your 50% deposit bonus
Learn to Trade
Never Miss A Trade Again

Signal Notification
Real-time signal notifications whenever a signal is opened, closes or Updated

Get Alerts
Immediate alerts to your email and mobile phone.

Entry Price Levels
Entry price level for every signal Just choose one of our Top Brokers in the list above to get all this free.