STELLAR Price Analysis – March 23
In case the bulls increase their pressure, price may break up $0.20 level and increase towards the resistance level of $0.25 and $0.30. Should bears defend the resistance level of $0.20, bears’ pressure may increase to breakdown the support level of $0.18 which may decrease the price to the support level at $0.11 and $0.09
XLM/USD Market
Key Levels:
Resistance levels: $0.20, $0.25, $0.30
Support levels: $0.18, $0.11, $0.09
XLM/USD Long-term Trend: Bullish
Stellar is bullish on the daily chart. The coin was on the ranging movement last week, within the resistance levels of $0.20 and $0.18. The price has tested the support level of $0.18 three times. Meaning that, triple bottom chart pattern formed. The bulls are gaining more pressure to break up the resistance level of $0.20. Bulls may dominate the Stellar market soon.
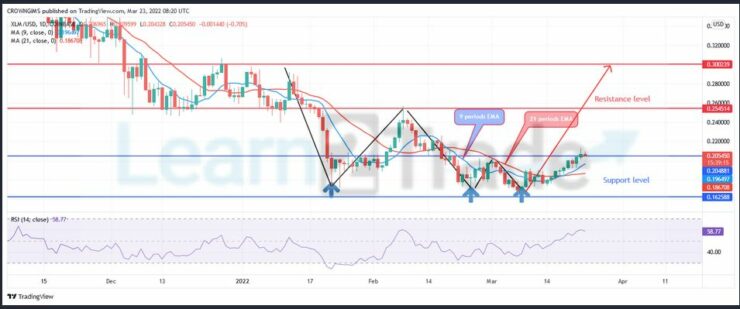
The price is trading above the 9 periods EMA and 21 periods EMA as a sign of bullish market. In case the bulls increase their pressure, price may break up $0.20 level and increase towards the resistance level of $0.25 and $0.30. Should bears defend the resistance level of $0.20, bears’ pressure may increase to breakdown the support level of $0.18 which may decrease the price to the support level at $0.11 and $0.09. The relative strength index period 14 is at 59 level displaying a bullish market direction.
XLM/USD Medium-term Trend: Bullish
Stellar is on the bullish movement in the 4-hour chart. The crypto was on the consolidation movement started two weeks ago. The price action formed a triple bottom chart pattern at $0.16 support level.
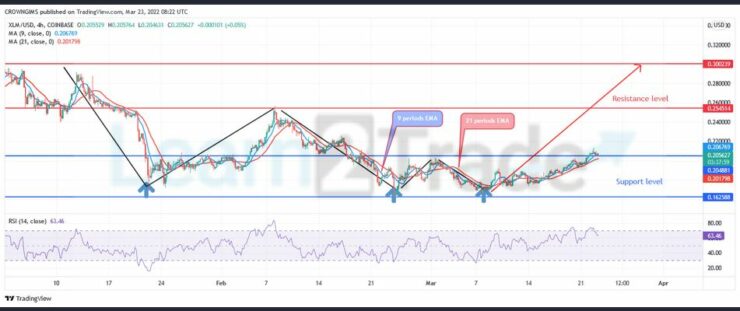
The two EMAs are bending upside as the price increases. The price is above the 9 periods EMA and 21 periods EMA indicating a bullish market. However, the Relative Strength Index periods 14 is at 64 levels with the signal line pointing down indicating a sell signal which may be a pullback.
You can purchase Lucky Block – Guide, Tips & Insights | Learn 2 Trade here. Buy LBlock:
- Broker
- Min Deposit
- Score
- Visit Broker

- Award-winning Cryptocurrency trading platform
- $100 minimum deposit,
- FCA & Cysec regulated

- 20% welcome bonus of upto $10,000
- Minimum deposit $100
- Verify your account before the bonus is credited
- Fund Moneta Markets account with a minimum of $250
- Opt in using the form to claim your 50% deposit bonus
Learn to Trade
Never Miss A Trade Again

Signal Notification
Real-time signal notifications whenever a signal is opened, closes or Updated

Get Alerts
Immediate alerts to your email and mobile phone.

Entry Price Levels
Entry price level for every signal Just choose one of our Top Brokers in the list above to get all this free.