Bears’ pressure increases and price decreases
STELLAR Price Analysis – November 17
The breakdown of $0.35 support level by the bears may decrease the price to the support level at $0.35 which may extend to $0.24 support level. In case the bulls interrupt the bearish movement, then, price may face the resistance levels at $0.41, $0.48 and $0.55.
XLM/USD Market
Key Levels:
Resistance levels: $0.41 $0.48, $0.55
Support levels: $0.35, $0.30, $0.24
XLM/USD Long-term Trend: Bearish
Stellar is bearish on the daily chart. Stellar had a partial breakout at the resistance level of $0.41 last week. The price was increasing towards the resistance level of $0.48 before the bears interrupted the bullish movement. The price changed direction towards the south and it penetrates the support level of $0.35. Further price decrease envisaged.
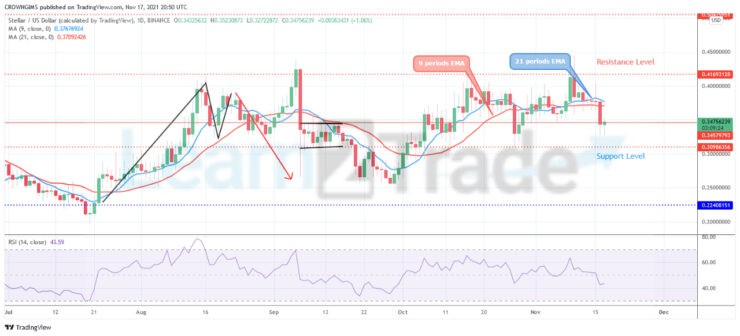
The bears’ pressure is increasing and the price is decreasing accordingly towards south. The price is trading below the 9 periods EMA and 21 periods EMA. The breakdown of $0.35 support level by the bears may decrease the price to the support level at $0.35 which may extend to $0.24 support level. In case the bulls interrupt the bearish movement, then, price may face the resistance levels at $0.41, $0.48 and $0.55. The relative strength index period 14 is at 40 level bending down to indicate sell signal.
XLM/USD Medium-term Trend: Bearish
Stellar is on the bearish movement in the 4-hour chart. The coin was under the bulls control last week on the 4-hour chart. The bulls pushed the price above the resistance level of $0.41 on November 10 but the bears’ pressure over power the bulls; this scenario led to the formation of an inverted pin bar. This is what triggered the bearish movement. The price breaks down the support level of $0.35 today and it is currently pulling back.
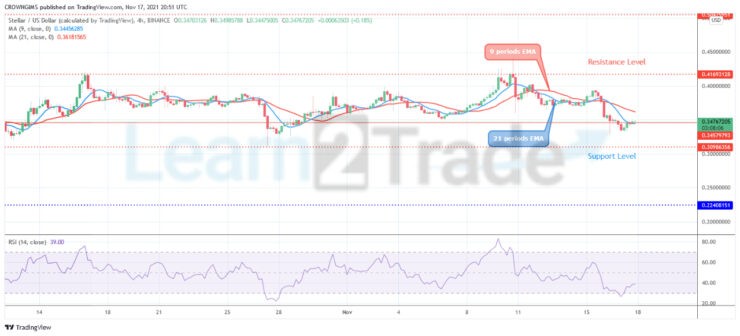
However, Stellar is trading below the 9 periods EMA and 21 periods EMA at close contact indicating sells’ pressure. The Relative Strength Index periods 14 is at 40 levels with the signal line pointing down indicating a sell signal.
You can purchase crypto coins here. Buy Tokens
- Broker
- Min Deposit
- Score
- Visit Broker

- Award-winning Cryptocurrency trading platform
- $100 minimum deposit,
- FCA & Cysec regulated

- 20% welcome bonus of upto $10,000
- Minimum deposit $100
- Verify your account before the bonus is credited
- Fund Moneta Markets account with a minimum of $250
- Opt in using the form to claim your 50% deposit bonus
Learn to Trade
Never Miss A Trade Again

Signal Notification
Real-time signal notifications whenever a signal is opened, closes or Updated

Get Alerts
Immediate alerts to your email and mobile phone.

Entry Price Levels
Entry price level for every signal Just choose one of our Top Brokers in the list above to get all this free.