Don’t invest unless you’re prepared to lose all the money you invest. This is a high-risk investment and you are unlikely to be protected if something goes wrong. Take 2 minutes to learn more
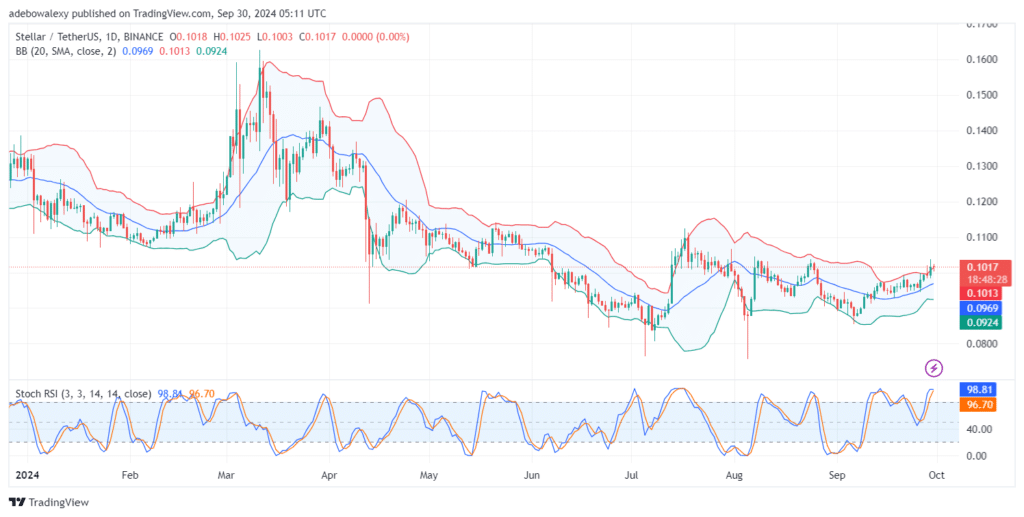
The Stellar daily market recently exited trading below the $0.1000 threshold, thanks to a steady upward retracement. As a result, upside forces seem to have encountered some headwinds after pushing the limit of a technical indicator. At the time of writing, the market has only experienced a minimal downward correction, while it still appears geared toward further growth.
Stellar May Easily Shake Off the Downward Retracement
Price action in the Stellar daily market continues to hug the upper limit of the Bollinger Bands indicator. This is despite the minimal downward retracement observed in the ongoing session. The market remains above the $0.1000 threshold.
The Stochastic Relative Strength Index (Stochastic RSI) indicator is in the overbought region and approaching a crossover. Since this crossover is about to occur deep in the overbought area, it appears likely. However, if upside forces continue to build, the lines may hover near the upper limit of the indicator.
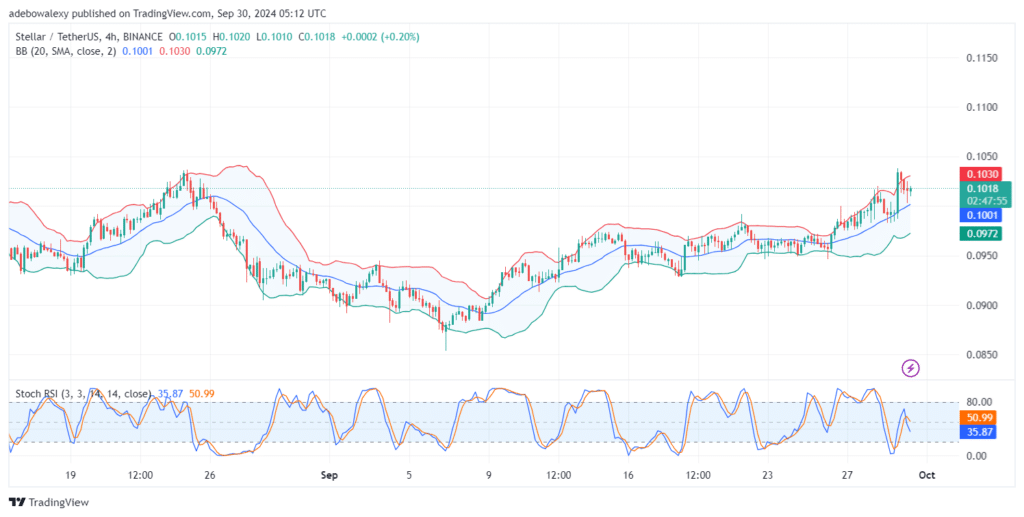
Upside Forces Are Taking Charge in the XLM Market
The Stellar 4-hour market reveals that upside forces are attempting to resist further downward retracement. The Bollinger Bands indicator shows an upward tilt. The most recent price candle appears green and is positioned above the middle band of the indicator.
However, the Stochastic RSI lines show a downward trajectory, with the leading lines below the 50 mark. Consequently, traders may wait for the trend to develop by using a buy-stop crypto signal, with an entry point around the $0.1030 price level in this market.
Trade on MT4 with Leverage up to 1:500! Trade on MT4 with Leverage up to 1:500!
X
We use cookies to ensure that we give you the best experience on our website. If you continue to use this site we will assume that you are happy with it.