Key Support Levels: $0.06, $0.05,$0.04
XLM/USD Long-term Trend: Bullish
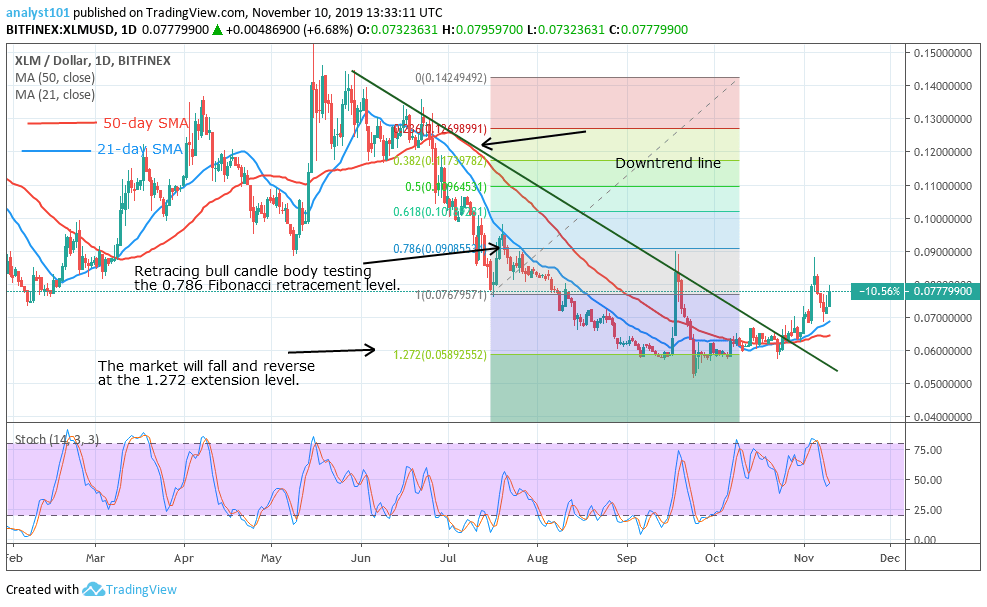
Stellar has been struggling to break the $0.09 resistance level after price rebounded at the $0.06 support level. In September, the bulls attempted to breach the $0.09 resistance but the bulls suffered a setback as the coin dropped to the $0.06 support level. In November, the price tested the $0.09 resistance and it fell to the $0.07 support level. Today, Stellar is making an upward move to retest the $0.09 resistance level.
The market is rising and if the bulls succeed in overcoming the $0.09 resistance, XLM will rise and reach the $0.13 price level. However, if the bulls are overwhelmed at the resistance, the coin will fall or be compelled to a sideways move.
Daily Chart Indicators Reading:
The coin has broken the downtrend line after making a second attempt to breach it. However, the bulls are in control of price but the market trades below the $0.09 resistance level. The market has reversed at the 1.272 Fibonacci extension level as indicated by the tool.
XLM/USD Medium-term bias: Bullish
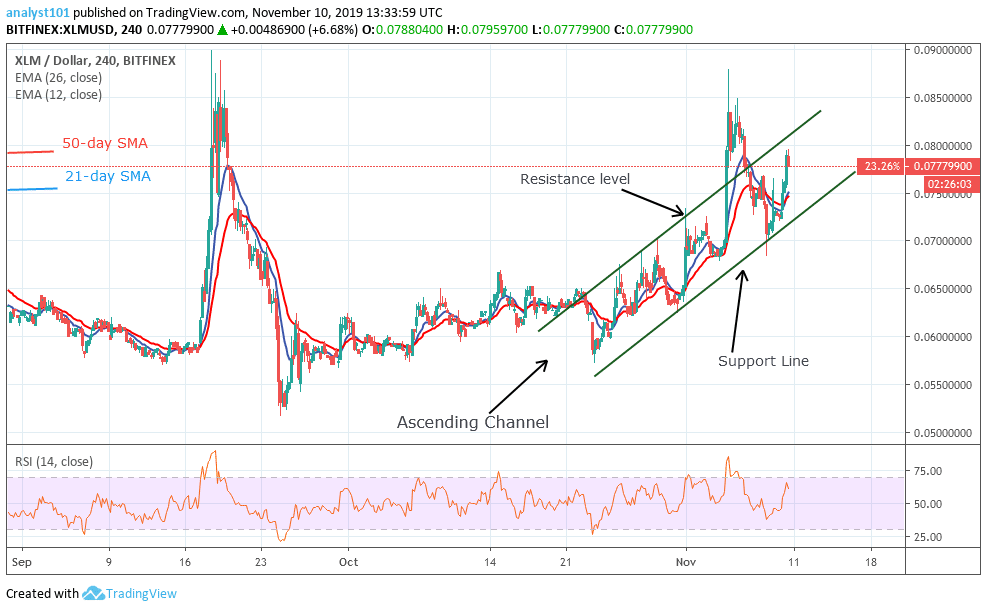
In November, the price is making a series of higher highs and higher lows as it moves up to test the $0.085 resistance level. The price fell to a low of $0.07 and resumed another bullish move.
4-hour Chart Indicators Reading
Stella is trading in an ascending channel as price makes a false breakout and falls back to the channel. Also, the market is trading in the bullish trend zone of the RSI period 14 level 66. This indicates the coin is rising.
General Outlook for Stellar
Stellar has recovered as it breaks the downtrend line. This implies that the bulls have an upper hand above the bears. The price of XLM is above the EMAs which indicates that the price is rising. However, if the price falls below the EMAs, this will portray a negative sign as the bears will resume selling pressure. Nevertheless, a sustained bullish momentum will propel the price to reach the previous highs.
Stellar Trade Signal
Instrument: XLM/USD
Order: Buy
Entry price: $0.077
Stop: $0.065
Target: $0.09
- Broker
- Min Deposit
- Score
- Visit Broker
- Award-winning Cryptocurrency trading platform
- $100 minimum deposit,
- FCA & Cysec regulated
- 20% welcome bonus of upto $10,000
- Minimum deposit $100
- Verify your account before the bonus is credited
- Fund Moneta Markets account with a minimum of $250
- Opt in using the form to claim your 50% deposit bonus
Learn to Trade
Never Miss A Trade Again

Signal Notification
Real-time signal notifications whenever a signal is opened, closes or Updated

Get Alerts
Immediate alerts to your email and mobile phone.

Entry Price Levels
Entry price level for every signal Just choose one of our Top Brokers in the list above to get all this free.


