Annual Forecast for Stellar (2022)
In case price break down the support level of $0.24, it may decrease to $0.20 and $0.16 levels. When the buyers defend the support level of $0.24, it may increase and break out at $0.41 in which $0.50 and $0.57 may be tested.
XLM/USD Market
Key Levels:
Resistance levels: $0.41, $0.50, $0.57, $0.78
Support levels: $0.24, $0.20, $0.16, $0.11
XLM/USD Long-term Trend: Bullish Bias
Stellar is on the ranging movement on the weekly chart. The crypto started well last year in favor of the buyers. It commenced bullish movement at the first week of last year with formation of strong and big bullish candle. The price increased and tested the resistance level of $0.7825 on May; that was the peak of last year. A weekly bearish engulfing candle formed as an indication that sellers were prevailing. The price tested the support level of $0.24 in July. Since then till moment, price has been ranging within $0.24 and $0.41 levels on the weekly chart.
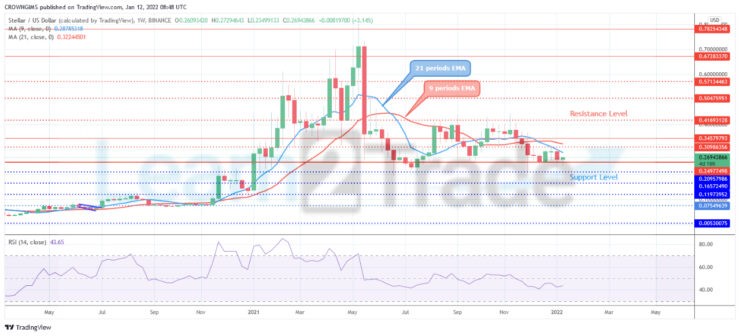
On the weekly chart, it seems sellers’ momentum equal buyers’ momentum and that is why the market is experiencing a ranging movement. In case price break down the support level of $0.24, it may decrease to $0.20 and $0.16 levels. When the buyers defend the support level of $0.24, it may increase and break out at $0.41 in which $0.50 and $0.57 may be tested. Meanwhile, the relative strength index period 14 is above 40 levels displaying a bullish signal
XLM/USD Medium-term Trend: Bullish
Stellar is bearish on the daily chart. The resistance level of $0.7825 was reached last year. The sellers opposed further increase with formation of daily bearish candles. The price declined and tested the support level of $0.20 in June. It bounces up to the resistance level of $0.4169 but unable to break it up. From June last year till date, it is on the ranging movement within $0.4169 and $0.2497.
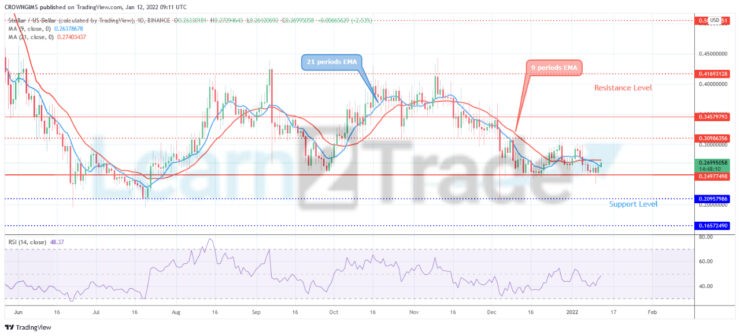
Stellar is trading around 9 periods EMA and 21 periods EMA. Further push by the bulls may bring the coin above the resistance level of $0.41. The Relative Strength Index periods 14 moves to the 50 levels and the signal line pointing up to indicate the buy signal.
You can purchase crypto coins here. Buy Tokens
- Broker
- Min Deposit
- Score
- Visit Broker

- Award-winning Cryptocurrency trading platform
- $100 minimum deposit,
- FCA & Cysec regulated

- 20% welcome bonus of upto $10,000
- Minimum deposit $100
- Verify your account before the bonus is credited
- Fund Moneta Markets account with a minimum of $250
- Opt in using the form to claim your 50% deposit bonus
Learn to Trade
Never Miss A Trade Again

Signal Notification
Real-time signal notifications whenever a signal is opened, closes or Updated

Get Alerts
Immediate alerts to your email and mobile phone.

Entry Price Levels
Entry price level for every signal Just choose one of our Top Brokers in the list above to get all this free.