STELLAR Price Analysis – January 05
In case the bulls increase their momentum, the price may penetrate $0.30 level upside and increase to $0.34, which may extend to $0.41. Should the resistance level of $0.30 holds, the price may decrease to the support level at $0.20 and $0.16 if the $0.24 level permits
XLM/USD Market
Key Levels:
Resistance levels: $0.30, $0.34, $0.41
Support levels: $0.24, $0.20, $0.16
XLM/USD Long-term Trend: Bullish
Stellar is on the bullish movement on the daily chart. The price action on the daily chart is forming a “W” chart pattern. The coin found support at $0.24 on December 13, it consolidates for few days. The bulls gained pressure and push up price to test $0.30 level. The mentioned level holds and it decreased to retest $0.24 support level on 31 December. At the moment, Stellar market is dominated by bulls.
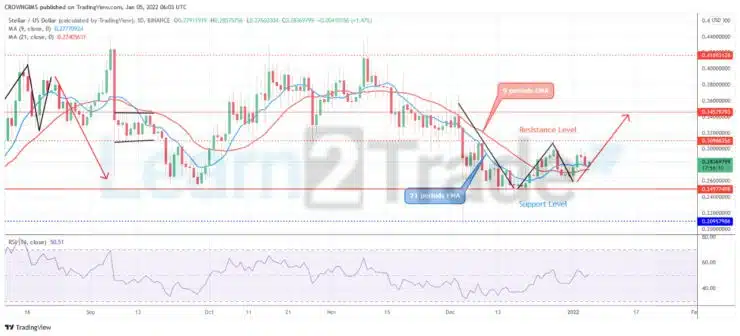
On the daily chart, sellers are losing momentum at the support level of $0.24. The price is crossing over the 9 periods EMA and 21 periods EMA upside and the former EMA has crossed the later EMA trying to establishing a bullish trend. In case the bulls increase their momentum, the price may penetrate $0.30 level upside and increase to $0.34, which may extend to $0.41. Should the resistance level of $0.30 holds, the price may decrease to the support level at $0.20 and $0.16 if the $0.24 level permits. Meanwhile, the relative strength index period 14 is at 50 levels displaying a bullish signal
XLM/USD Medium-term Trend: Bullish
Stellar is bullish on the 4-hour chart. The formation of double bottom chart pattern at the support level of $0.24 continues. The crypto tested the support level at $0.24 on December 17. The bearish pressure become weaken and the price increases gradually to test the resistance level of $0.30. There is tendency for the price to increase to $0.34.
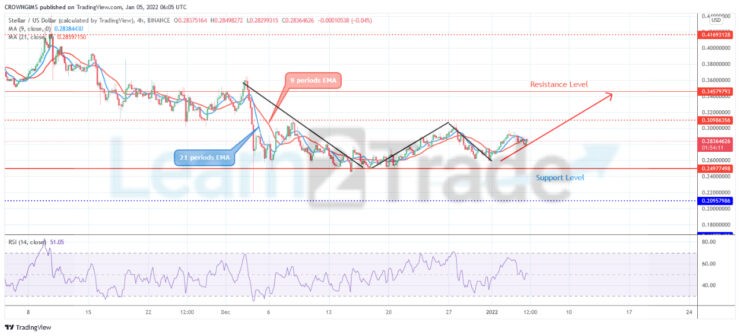
Stellar is trading above 9 periods EMA and 21 periods EMA. Further push by the bulls may bring the coin to the resistance level of $0.34. The Relative Strength Index periods 14 moves above the 50 levels and the signal line pointing up to indicate the buy signal.
You can purchase crypto coins here. Buy Tokens
- Broker
- Min Deposit
- Score
- Visit Broker

- Award-winning Cryptocurrency trading platform
- $100 minimum deposit,
- FCA & Cysec regulated

- 20% welcome bonus of upto $10,000
- Minimum deposit $100
- Verify your account before the bonus is credited
- Fund Moneta Markets account with a minimum of $250
- Opt in using the form to claim your 50% deposit bonus
Learn to Trade
Never Miss A Trade Again

Signal Notification
Real-time signal notifications whenever a signal is opened, closes or Updated

Get Alerts
Immediate alerts to your email and mobile phone.

Entry Price Levels
Entry price level for every signal Just choose one of our Top Brokers in the list above to get all this free.