Don’t invest unless you’re prepared to lose all the money you invest. This is a high-risk investment and you are unlikely to be protected if something goes wrong. Take 2 minutes to learn more
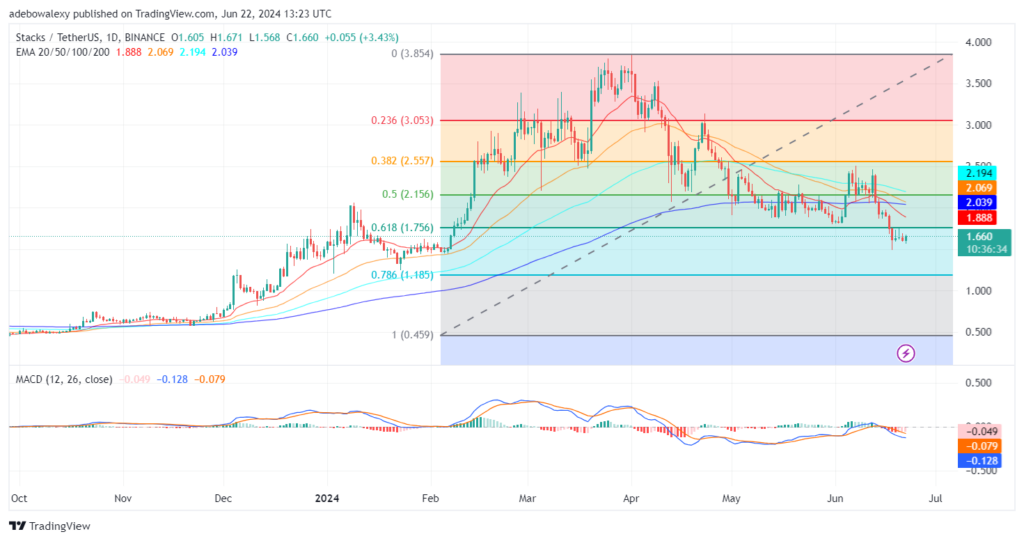
A sharp downward correction occurred in the Stacks daily market over the past nine sessions. However, the market rebounded off the technical price level of $1.500. Despite the rebound, price action was unable to rise considerably upward afterward. Let’s see what may become of this market shortly.
Key Price Levels:
Resistance: $2.000, $2.500, and $3.000
Support: $1.500, $1.000, and $0.500
Stacks Market Sees the Most Significant Price Increase in Recent Sessions
While price movement in the STX daily market appears to lack considerable volatility, today’s trading activity has seen the most conspicuous price increase in recent sessions. However, even with the seen increase, price action can be seen below the intercalating lines of the Exponential Moving Average (EMA).
Nevertheless, with the price increase seen in the ongoing session, the market continues to close in on the resistance at the 61.80 Fibonacci Retracement level. Likewise, the bars of the Moving Average Convergence Divergence (MACD) indicator reveals that downward forces are losing momentum to upside ones. Consequently, this hints that the market may further approach the 61.80 Fibonacci Retracement level as a resistance.
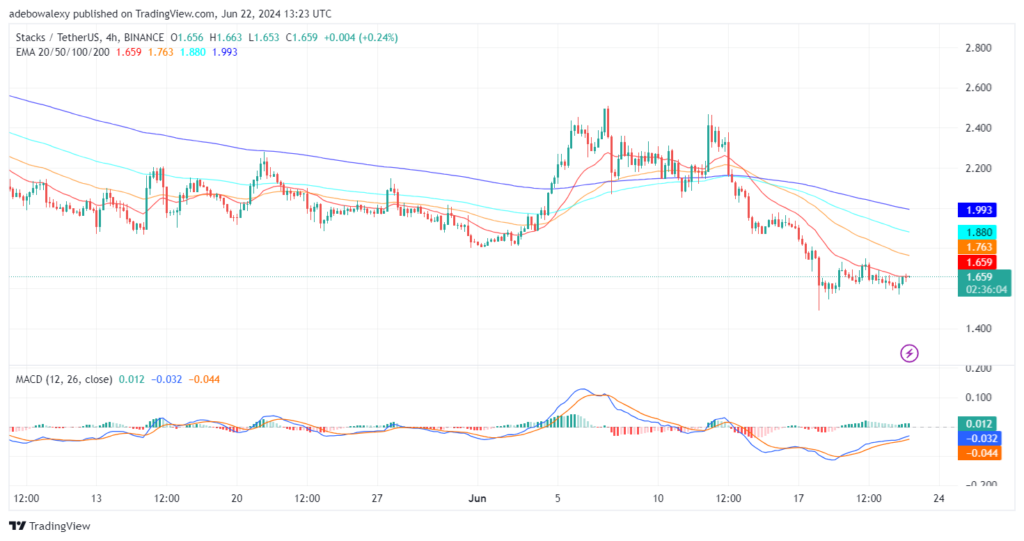
STX Market Shows Bullish Prospects While Under Pressure
It can be seen that price activity in the Stacks 4-hour market hints at the possibility of price action gaining more momentum shortly. In this market time frame, we can see that price action has started hugging the 20-day EMA lines from below. Meanwhile, the last price candle appears green despite its tiny size.
At the same time, MACD indicator lines are still rising upwards from below the equilibrium level. The indicator bars also appear solid green. This suggests that the upside forces propelling the market are still capable of pushing the market further upwards. Therefore, traders can still use crypto signals focusing on the $1.800 mark.
Trade on MT4 with Leverage up to 1:500! Trade on MT4 with Leverage up to 1:500!
X
We use cookies to ensure that we give you the best experience on our website. If you continue to use this site we will assume that you are happy with it.