Buyers are making progress
SPONGE (SPONGEUSDT) Price Analysis – 20 November
If the $0.000081 level holds, the goals might be the resistance levels of $0.000136, $0.000196, and $0.000330. If the bearish trend breaks through the $0.000081 level, it is possible to challenge the support levels of $0.000006 and $0.000004.
SPONGEUSDT Market
Key levels:
Resistance levels: $0.000136, $0.000196, $$0.000330
Support levels: $0.000081, $0.000006, $0.000004
SPONGEUSDT Long-term Trend: Bullish
Sponge seems to have a promising future. Consumers are not yet worn out. The demand from customers is driving up the price of sponges. On September 6, the $0.000136 resistance level was not maintained. There were more bullish candles every day. At $0.000136, the price exceeded a critical pricing threshold. Last week, the price moved between the specified resistance levels. In an effort to draw in additional investors, sellers raised their pressure and broke the level near the end of the week. In an effort to reach the $0.000136 target, buyers are currently applying further pressure.

The EMA Cross crypto signaling indicator and the price trading above both show how successfully the Sponge market is doing. If the $0.000081 level holds, the goals might be the resistance levels of $0.000136, $0.000196, and $0.000330. If the bearish trend breaks through the $0.000081 level, it is possible to challenge the support levels of $0.000006 and $0.000004.
SPONGEUSDT Medium-term Trend: Bullish
The Sponge chart can exhibit a positive trend for four hours. There was no bearish market reversal as a result of the selling disruption. At the previously suggested resistance level, it appears that the bulls’ pressure has not yet subsided. Strong bullish candles appeared on October 14, suggesting that buyers are making progress. The price will increase to about $0.000196 after breaking through the $0.000136 barrier.
 .000196 Level" width="638" height="515" data-lazy-src="https://learn2.trade/wp-content/uploads/2025/11/4-hours-53.png"/>
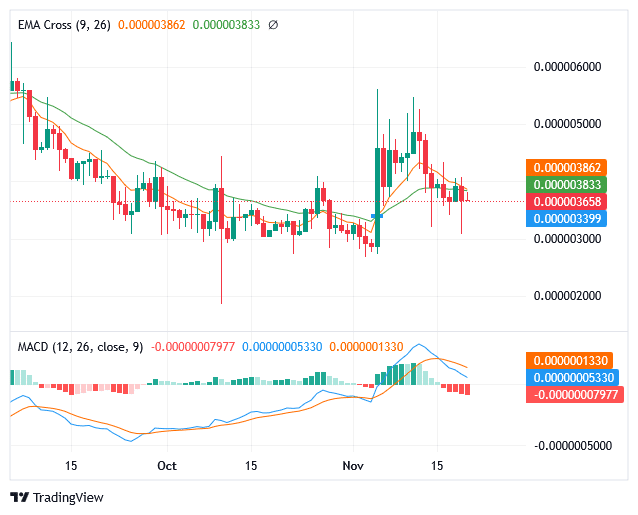
It appears that buyers are becoming more active because it is more costly than the EMA Cross indicator. A buy signal is shown by the MACD.
When it immediately starts to pump after you sell
When it pumps right after you sell pic.twitter.com/qy7xKuCLU0
— $SPONGE (@spongeoneth) November 10, 2025
Start using a world-class auto trading solution
- Broker
- Min Deposit
- Score
- Visit Broker

- Award-winning Cryptocurrency trading platform
- $100 minimum deposit,
- FCA & Cysec regulated

- 20% welcome bonus of upto $10,000
- Minimum deposit $100
- Verify your account before the bonus is credited
- Fund Moneta Markets account with a minimum of $250
- Opt in using the form to claim your 50% deposit bonus
Learn to Trade
Never Miss A Trade Again

Signal Notification
Real-time signal notifications whenever a signal is opened, closes or Updated

Get Alerts
Immediate alerts to your email and mobile phone.

Entry Price Levels
Entry price level for every signal Just choose one of our Top Brokers in the list above to get all this free.