Buyers are fully in chartge of S&P 500 market
S&P 500 Price Analysis – 21 November
If the $4532 level is held, the S&P 500 may rise considerably higher toward the resistance levels of $4606, $4723, and $4813 levels The price may rise above $4606 in total.
Key Levels:
Resistance levels: $4606, $4723, $4813
Support levels: $4532, $4437, $4345
S&P 500 Long-term trend: Bullish
The S&P 500 Index is rising. Since September 1st, sellers have been in charge of the S&P market’s pricing. A bearish reversal was signaled by the “M” chart pattern close to the $4526 barrier level. On October 3, the selling pressure caused the price to test the $4180 mark. Buyers were holding the just specified support level, then, the price direction changed to bullish. S&P 500 soars to the moon by penetrating $4345, 44437 and $4532 levels. It is currently exposed to $4606 level.

If the $4532 level is held, the S&P 500 may rise considerably higher toward the resistance levels of $4606, $4723, and $4813 levels. The signal line’s inclining trend and the period 14 relative strength index’s 71 rating both suggest a buy. The price may rise above $4606 in total.
S&P 500 Medium-term Trend: Bullish
The four-hour chart of the S&P 500 exhibits positive tendencies. The price is increasing above the $4606 resistance level as a result of the double bottom chart pattern that appeared at the $4180 support level. The bulls have maintained the previously set level as the price risen. The bullish engulfing candle that emerged last week suggests that the $4606 mark is the current target for the price.
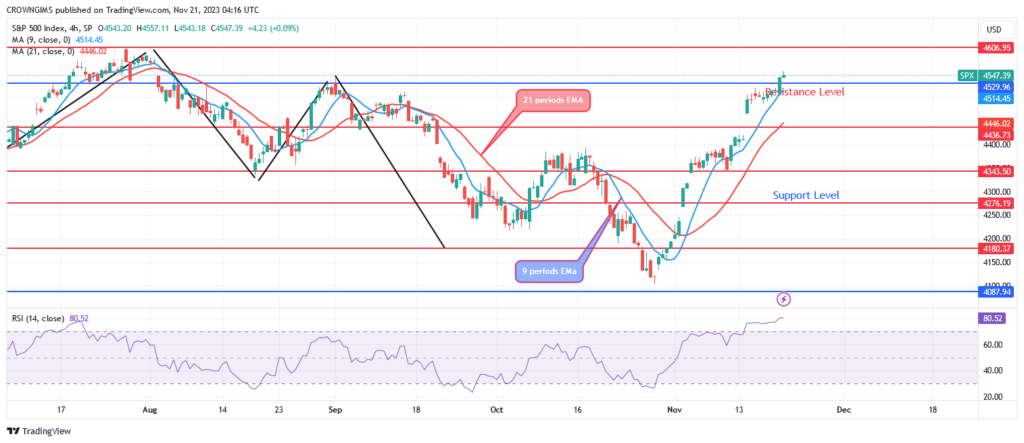
The price of the S&P 500 is higher than the 21- and 9-period EMAs. The Relative Strength Index period 14 indicates a bullish signal at level 80, which indicate an upturn.
You can purchase Lucky Block – Guide, Tips & Insights | Learn 2 Trade here. Buy LBLOCK
- Broker
- Min Deposit
- Score
- Visit Broker

- Award-winning Cryptocurrency trading platform
- $100 minimum deposit,
- FCA & Cysec regulated

- 20% welcome bonus of upto $10,000
- Minimum deposit $100
- Verify your account before the bonus is credited
- Fund Moneta Markets account with a minimum of $250
- Opt in using the form to claim your 50% deposit bonus
Learn to Trade
Never Miss A Trade Again

Signal Notification
Real-time signal notifications whenever a signal is opened, closes or Updated

Get Alerts
Immediate alerts to your email and mobile phone.

Entry Price Levels
Entry price level for every signal Just choose one of our Top Brokers in the list above to get all this free.