Bears may continue dominating S&P 500 market
S&P 500 Price Analysis – 28 February
S&P 500 may breach the $3927 support level if selling pressure increases, and further selling pressure could push the price down to the $3740 and $3649 levels. If the $3927 support level is held, the price may reverse and rise in the direction of the resistance levels of $4087, $4169, and $4276.
Key levels:
Resistance levels: $4087, $4169, $4276
Support levels: $3927, $3740, $3649
S&P 500 Long-term trend: Bearish
S&P 500 is moving in a bearish direction on the daily chart. The previous three weeks were a good buying season. The price was progressively rising until it reached the $4169 resistance level. Bulls’ impetus failed, and it was unable to break through the indicated level. The price fluctuated between $4169 and $4087 throughout the course of the week. On February 17, sellers drove the price below the $4087 level, and it is currently moving toward the $3927 level.
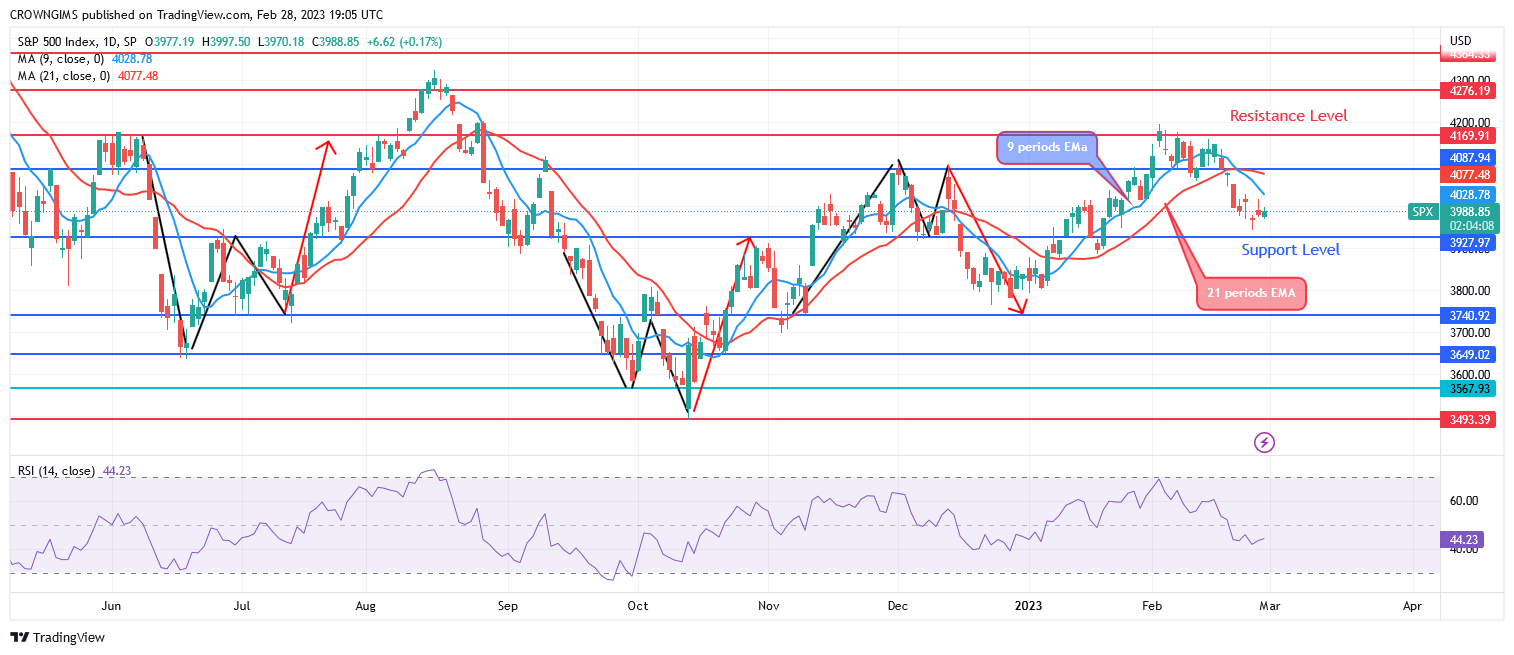
The 9-period and 21-period exponential moving averages are currently above S&P 500. The S&P 500 may breach the $3927 support level if selling pressure increases, and further selling pressure could push the price down to the $3740 and $3649 levels. If the $3927 support level is held, the price may reverse and rise in the direction of the resistance levels of $4087, $4169, and $4276. A sell signal is indicated by the relative strength index period 14 being at 44 and the signal line pointing downward.
S&P 500 Medium-term Trend: Bearish
On the 4-hour chart, the S&P 500 is in the bearish direction. The sellers held the $4169 resistance level, preventing the S&P 500 from rising much higher. As the price reached the $4169 resistance level, the buying power decreased. When the previously mentioned level is held, it started trade bearishly.
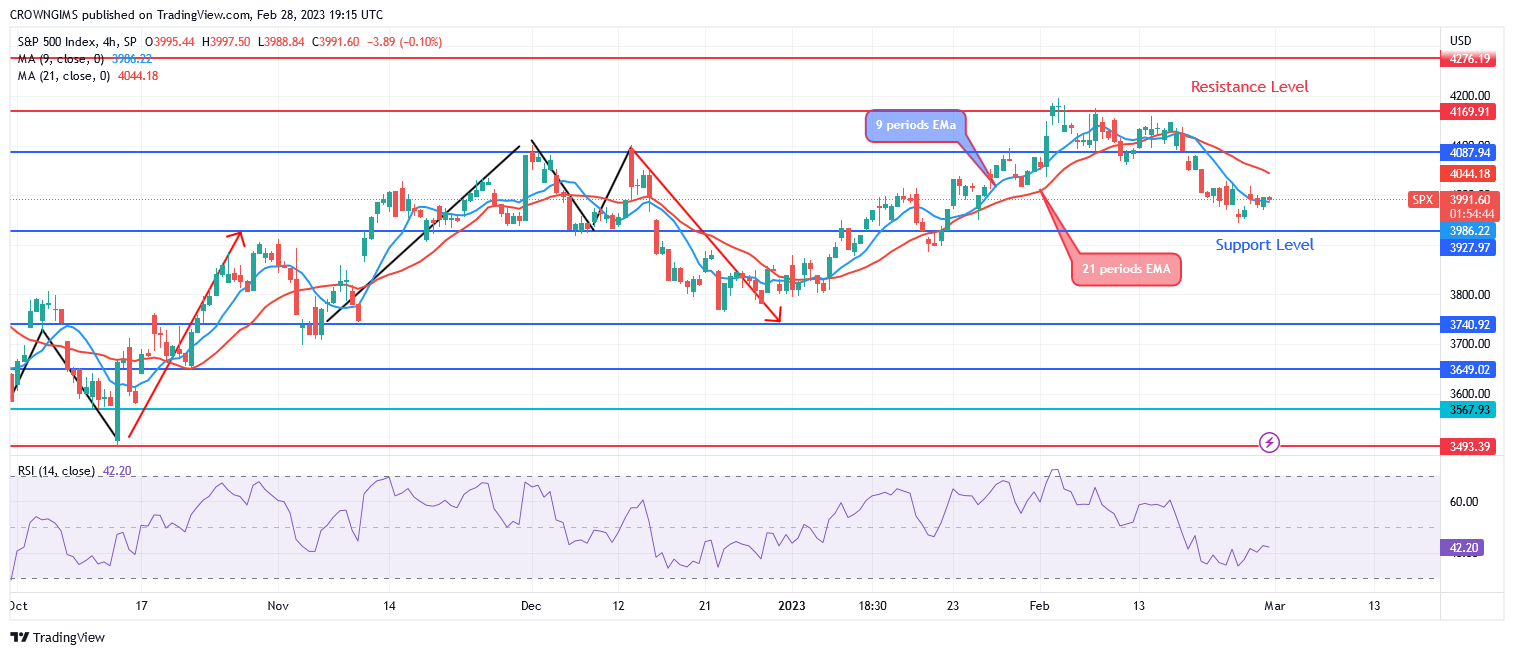
The price may continue to decline this week. The pricing right now is less than $4087. The price of the S&P 500 is trading lower than both the exponential moving averages of 9 and 21 periods. A bearish signal is visible on the Relative Strength Index period 14 at level 41.
You can purchase Lucky Block – Guide, Tips & Insights | Learn 2 Trade here. Buy LBLOCK
- Broker
- Min Deposit
- Score
- Visit Broker

- Award-winning Cryptocurrency trading platform
- $100 minimum deposit,
- FCA & Cysec regulated

- 20% welcome bonus of upto $10,000
- Minimum deposit $100
- Verify your account before the bonus is credited
- Fund Moneta Markets account with a minimum of $250
- Opt in using the form to claim your 50% deposit bonus
Learn to Trade
Never Miss A Trade Again

Signal Notification
Real-time signal notifications whenever a signal is opened, closes or Updated

Get Alerts
Immediate alerts to your email and mobile phone.

Entry Price Levels
Entry price level for every signal Just choose one of our Top Brokers in the list above to get all this free.