Sellers’ pressure is increasing in S&P 500 market
S&P 500 Price Analysis – 15 August
In case the $4364 level is held, S&P 500 may incline in the direction of the resistance levels of $4476, $4631, and $4723. If the $4364 support level is broken, the price may decline to $4276 support level and continue to reduce downward to $4180
Key Levels:
Resistance levels: $4476, $4631, $4723
Support levels: $4364, $4276, $4180
S&P 500 Long-term trend: Bearish
On the daily chart, the S&P 500 is moving in the bearish direction. The price was able to reach the high of $3631 resistance level when there was buying pressure in the S&P market. On 27 July, rising bearish pressure began, breaking the low of $4476 level. The bulls appeared to be worn out because they failed to raise the price over the previous level. Bearish pressure increased, and the price is now retracing toward the $4364 support level.
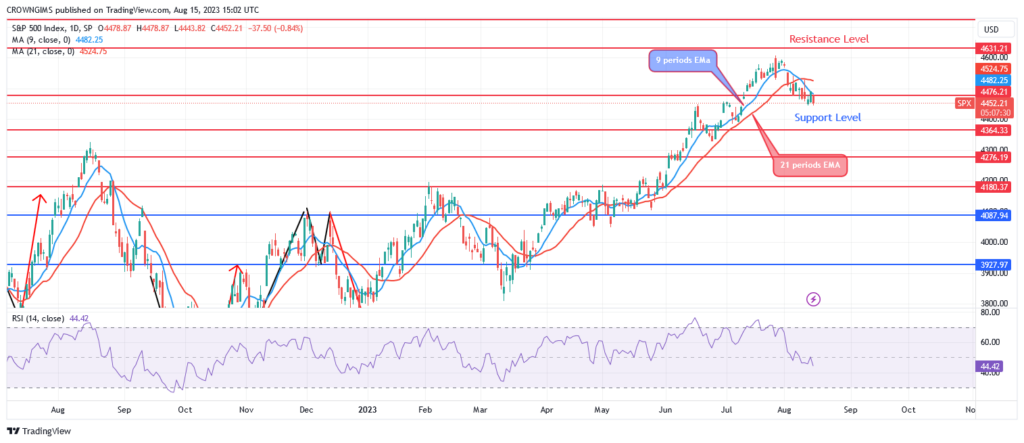
If the $4364 level is held, the price may incline in the direction of the resistance levels of $4476, $4631, and $4723. A sell signal is indicated by the relative strength index period 14 being at 45 and the signal line pointing downward. If the $4364 support level is broken, the price may decline to $4276 support level and continue to reduce downward to $4180.
S&P 500 Medium-term Trend: Bearish
On the 4-hour chart, the S&P 500 is trending downward. The sellers were able to prevent the price of the S&P 500 from climbing significantly by holding the $4631 barrier level. As soon as it cleared the $4631 barrier level, consumer demand increased, and the price began to decline. As the price dropped, the psychological ceiling of $4476 came into view. The $4476 threshold level might have been crossed as selling pressure increased. $4364 is the current objective level.
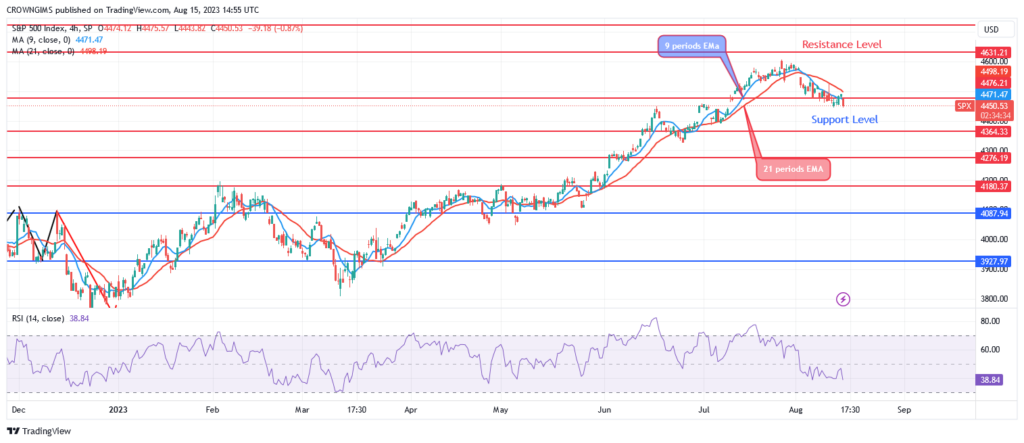
The price of the S&P 500 is currently lower than both the exponential moving averages of 9 and 21 periods. A bearish signal is shown by the Relative Strength Index period 14 at level 35.
You can purchase Lucky Block – Guide, Tips & Insights | Learn 2 Trade here. Buy LBLOCK
- Broker
- Min Deposit
- Score
- Visit Broker

- Award-winning Cryptocurrency trading platform
- $100 minimum deposit,
- FCA & Cysec regulated

- 20% welcome bonus of upto $10,000
- Minimum deposit $100
- Verify your account before the bonus is credited
- Fund Moneta Markets account with a minimum of $250
- Opt in using the form to claim your 50% deposit bonus
Learn to Trade
Never Miss A Trade Again

Signal Notification
Real-time signal notifications whenever a signal is opened, closes or Updated

Get Alerts
Immediate alerts to your email and mobile phone.

Entry Price Levels
Entry price level for every signal Just choose one of our Top Brokers in the list above to get all this free.