Sellers are in charge of S&P 500 market
S&P 500 Price Analysis – 29 August
The price may increase to the $4631 barrier level and continue to rise until it hits $4723 if the $4476 resistance level is broken. If the $4476 level is held, S&P 500 may continue moving in the direction of the support levels of $4364, $4276, and $4180
Key Levels:
Resistance levels: $4476, $4631, $4723
Support levels: $4364, $4276, $4180
S&P 500 Long-term trend: Bearish
On the daily chart, the S&P 500 is moving in the bearish direction. The price of the S&P market was able to surpass the $3631 resistance level and peak at $4631 when there was buying pressure. Bulls’ impetus wore out because they were unable to raise the price over the previous level. Beginning on July 27, increasing negative pressure burst past the $4476 barrier. As a result of increasing negative pressure, the price is currently reversing in the direction of the $4364 support level.
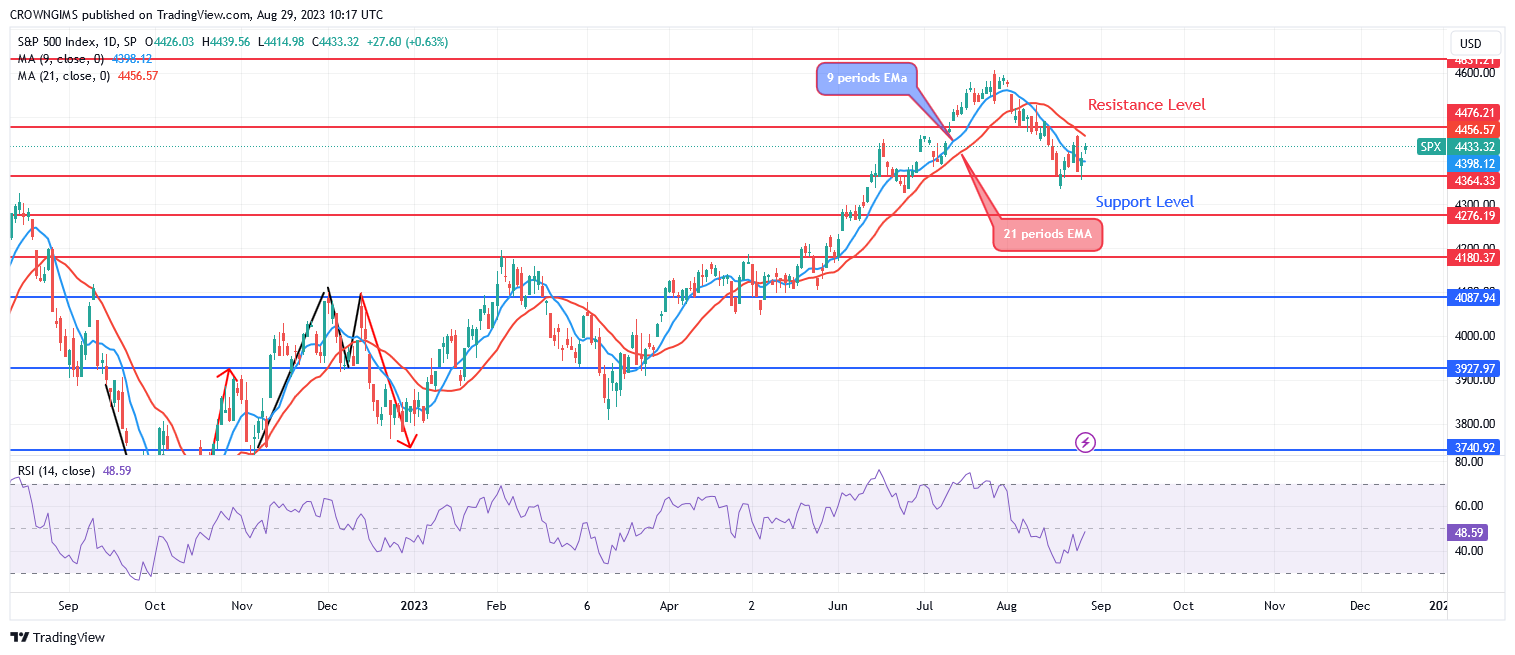
If the $4476 level is held, the price may continue moving in the direction of the support levels of $4364, $4276, and $4180. A buy signal, which may be a retreat, is shown by the relative strength index period 14 being at 48 and the signal line pointing upward. The price may increase to the $4631 barrier level and continue to rise until it hits $4723 if the $4476 resistance level is broken.
S&P 500 Medium-term Trend: Bearish
On the 4-hour chart, the S&P 500 is trending downward. The sellers were successful in preventing a big increase in the price of the S&P 500 by maintaining the $4476 barrier level. As soon as it exceeded the $4631 barrier level, consumer demand rose and the price started to decline. As S&P 500 dropped, the psychological ceiling of $4476 came into view. As selling pressure increases, it’s probable that the $4364 threshold level will be crossed. $4364 support level is the current objective level.
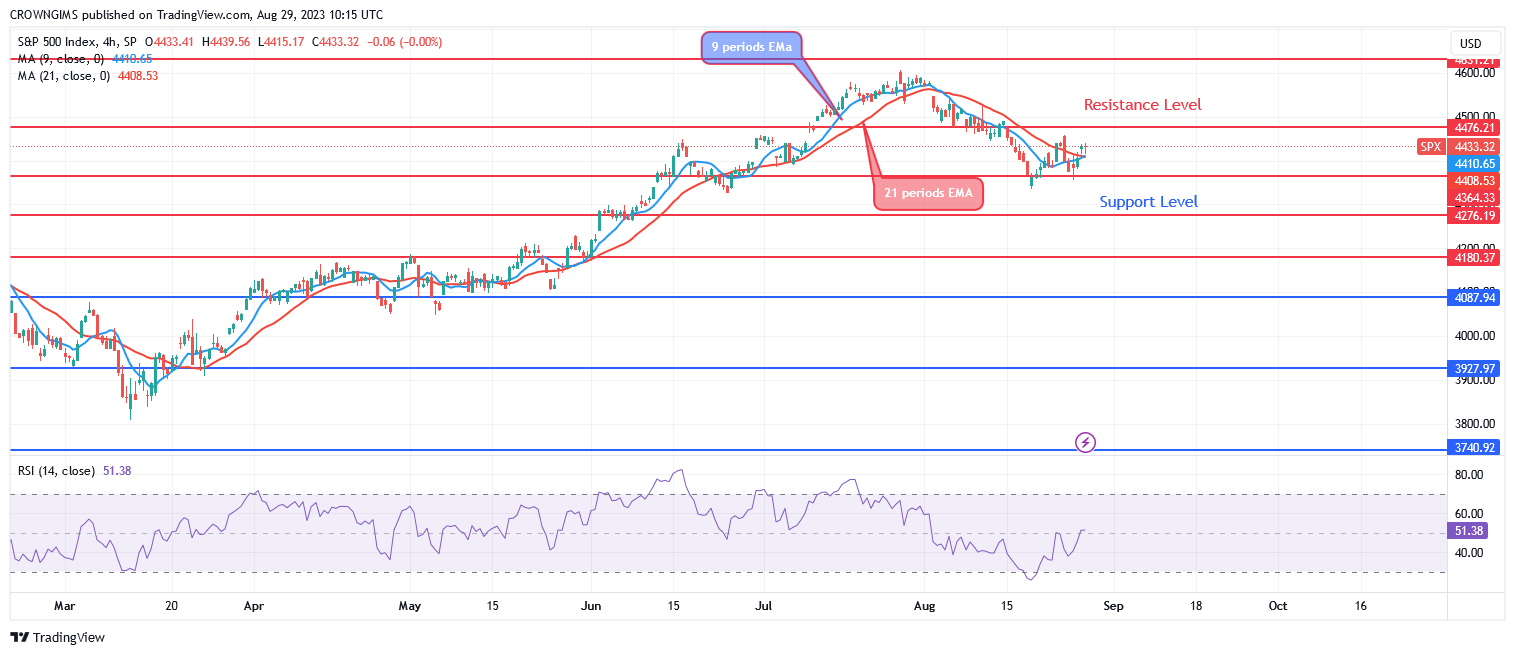
The price of the S&P 500 is currently lower than both the 9- and 21-period exponential moving averages. At level 51, the Relative Strength Index period 14 exhibits a bullish signal that could indicate a pullback..
You can purchase Lucky Block – Guide, Tips & Insights | Learn 2 Trade here. Buy LBLOCK
- Broker
- Min Deposit
- Score
- Visit Broker

- Award-winning Cryptocurrency trading platform
- $100 minimum deposit,
- FCA & Cysec regulated

- 20% welcome bonus of upto $10,000
- Minimum deposit $100
- Verify your account before the bonus is credited
- Fund Moneta Markets account with a minimum of $250
- Opt in using the form to claim your 50% deposit bonus
Learn to Trade
Never Miss A Trade Again

Signal Notification
Real-time signal notifications whenever a signal is opened, closes or Updated

Get Alerts
Immediate alerts to your email and mobile phone.

Entry Price Levels
Entry price level for every signal Just choose one of our Top Brokers in the list above to get all this free.