Buyers are controlling S&P 500 market
S&P 500 Price Analysis – 16 July
The resistance levels of $6290, $6300, and $6350 could be approached by the S&P 500. This is predicated on the $6262 position remaining stable. If the price breaks through the $6262 support level, it might test the $6151 and $6020 possibilities.
Key Levels:
Resistance levels: $6290, $6300, $6350
Support levels: $6262, $6151, $6020
S&P 500 Long-term trend: Bullish
The daily chart of the S&P 500 Index shows an upward trend. For over two weeks, bulls have controlled the market. Subtractions have been the primary driver of the indicator since February 19. Another attempt to reach the $6300 milestone was made on February 18; additional visits are expected if the request is granted. By keeping the fixed price at the first recommended position, the purchasers were able to temporarily stop further price declines, and the double-bottom bullish reversal map pattern held up at $6262. The S&P 500 rose from its $6020 position to the $6290 barrier level. At the moment, the price is rising and approaching $6290.
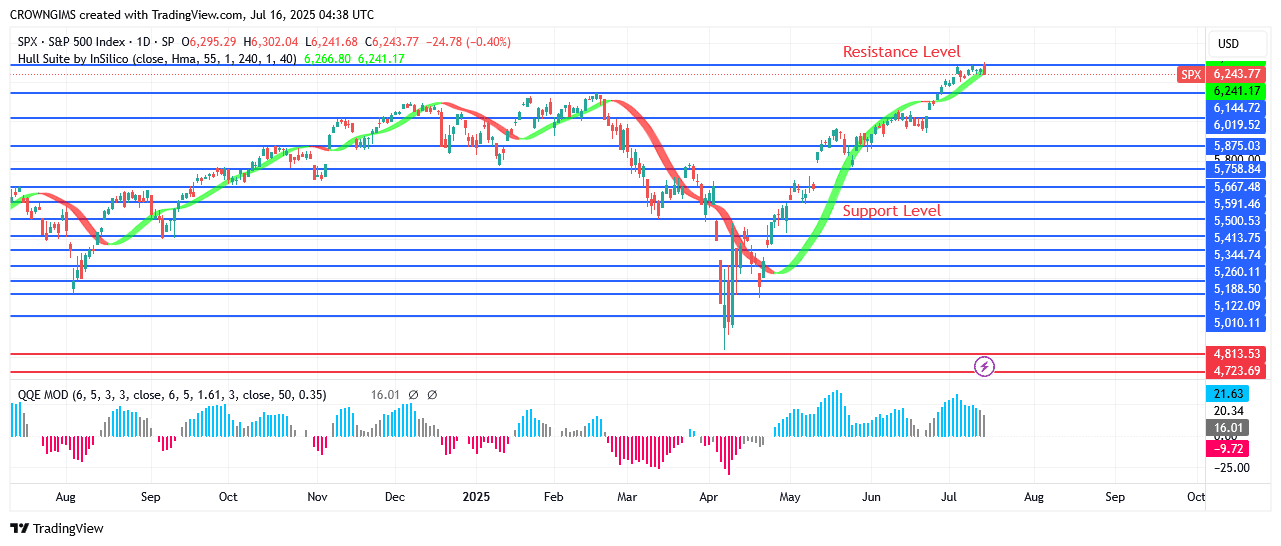
The resistance levels of $6290, $6300, and $6350 could be approached by the S&P 500. This is predicated on the $6262 position remaining stable. If the price breaks through the $6262 support level, it might test the $6151 and $6020 possibilities. The QQE MOD histogram and the Hull Suite crypto signals both suggest a buy. It may all go according to plan.
S&P 500 Medium-term Trend: Bullish
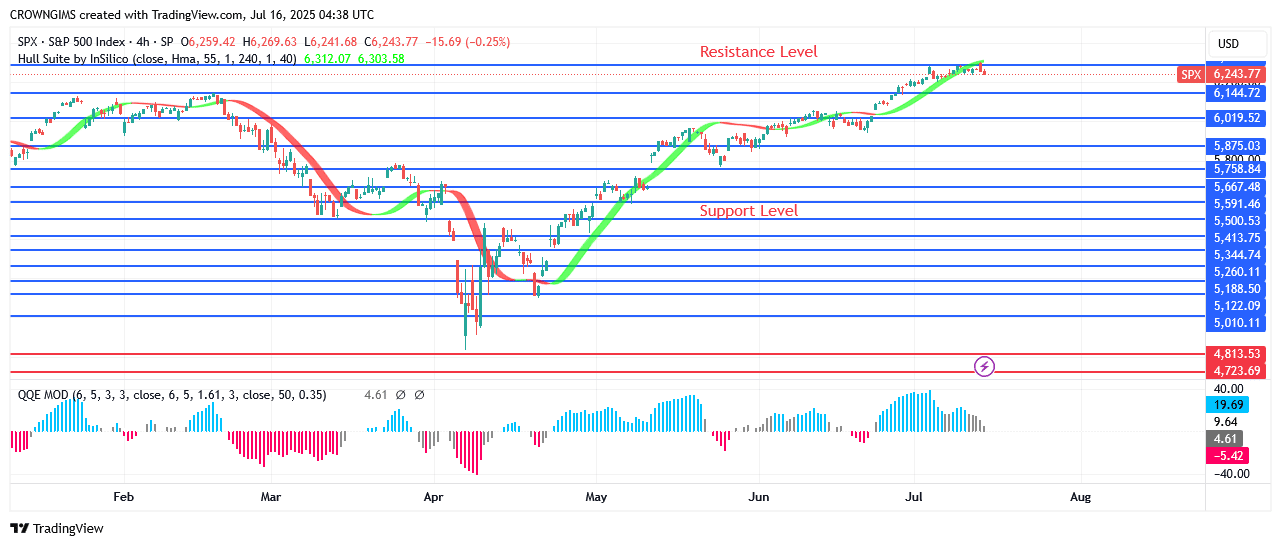
The S&P 500’s 4-hour graphic displays an upward trend. Because of the strong support from the bulls, the price has not dropped below the $6262 hedge position for the first week. The bulls have remained stable at their designated levels as the price has been climbing. The price is currently inclining toward $6300 due to an engulfing candle pattern. Since it bounced back from $5878, the value of the S&P 500 has been rising.
Start using a world-class auto trading solution
You can purchase Lucky Block – Guide, Tips & Insights | Learn 2 Trade here. Buy LBLOCK
- Broker
- Min Deposit
- Score
- Visit Broker

- Award-winning Cryptocurrency trading platform
- $100 minimum deposit,
- FCA & Cysec regulated

- 20% welcome bonus of upto $10,000
- Minimum deposit $100
- Verify your account before the bonus is credited
- Fund Moneta Markets account with a minimum of $250
- Opt in using the form to claim your 50% deposit bonus
Learn to Trade
Never Miss A Trade Again

Signal Notification
Real-time signal notifications whenever a signal is opened, closes or Updated

Get Alerts
Immediate alerts to your email and mobile phone.

Entry Price Levels
Entry price level for every signal Just choose one of our Top Brokers in the list above to get all this free.