Bears may dominate S&P 500 market
S&P 500 Price Analysis – 31 January
Should buying pressure picks up, the S&P 500 may break through the $4087 resistance level, and further buying pressure could drive the price up to the $4169 and $4276 levels. Price could reverse and fall in the direction of the support levels of $3929, $3740, and $3649 if the $4087 resistance level is maintained.
Key levels:
Resistance levels: $4087, $4169, $4276
Support levels: $3929, $3740, $3649
S&P 500 Long-term trend: Bullish
S&P 500 is on a bullish movement on the daily chart. Buyers pushed the price up to the $4087 ceiling on December 13. The resistance at the indicated level turned out to be a hurdle for the positive trend. A double top chart pattern that repelled buyers appeared at the level. The $3740 mark was reached with the aid of sellers’ pressure, but the price was unable to pass past it. It rebounded towards the north and the high of December was retested on 27 January. Today, sellers are dominating the market.
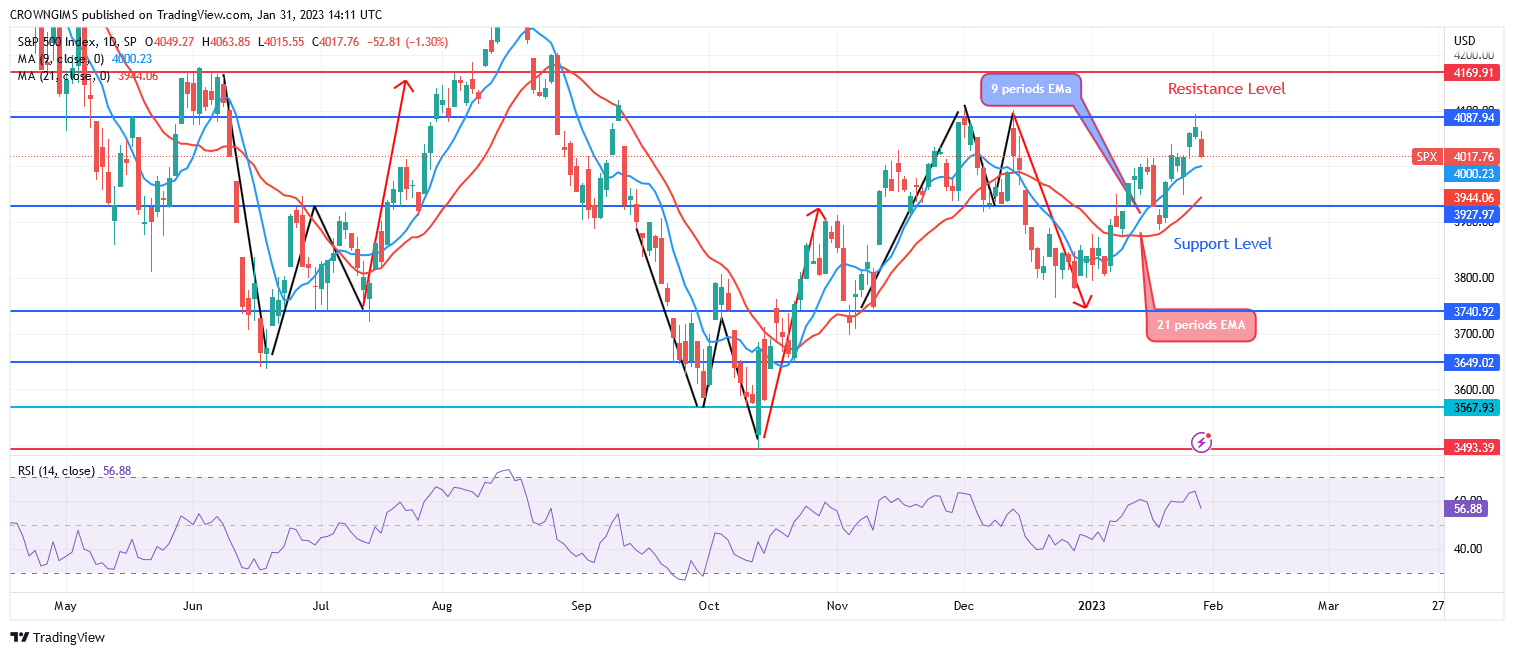
Currently, the S&P 500 is trading above both the 9-period and 21-period exponential moving averages, indicating bullish momentum. Should buying pressure picks up, the S&P 500 may break through the $4087 resistance level, and further buying pressure could drive the price up to the $4169 and $4276 levels. Price could reverse and fall in the direction of the support levels of $3929, $3740, and $3649 if the $4087 resistance level is maintained. The relative strength index period 14 is at 55, and the signal line is pointing down, indicating a sell signal.
S&P 500 Medium-term Trend: Bullish
The forecast on the 4-hour chart indicates that the S&P 500 should rise. When the price got close to the $3740 support level, the sellers’ power was lessened. In the 4-hour time frame, it started exchanging variants. When the bulls acquired more impetus, the price began to climb upward. The resistance level of $4087 was reached.
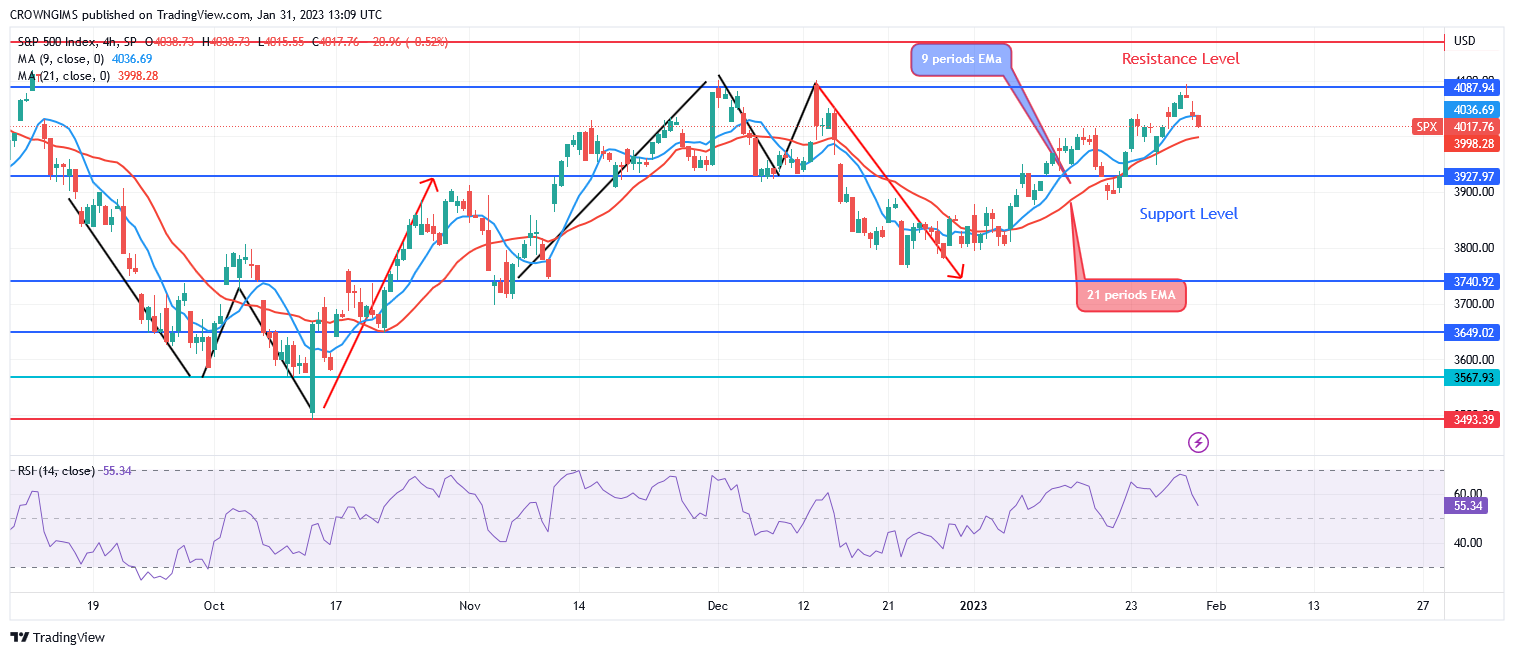
Price is currently pulling back from resistance at $4087. The price of the S&P 500 is decreasing since it is trading below the 9- periods EMA but above 21-periods exponential moving averages. A bearish signal is visible on the Relative Strength Index period 14 at 55 levels.
You can purchase Lucky Block – Guide, Tips & Insights | Learn 2 Trade here. Buy LBLOCK
- Broker
- Min Deposit
- Score
- Visit Broker

- Award-winning Cryptocurrency trading platform
- $100 minimum deposit,
- FCA & Cysec regulated

- 20% welcome bonus of upto $10,000
- Minimum deposit $100
- Verify your account before the bonus is credited
- Fund Moneta Markets account with a minimum of $250
- Opt in using the form to claim your 50% deposit bonus
Learn to Trade
Never Miss A Trade Again

Signal Notification
Real-time signal notifications whenever a signal is opened, closes or Updated

Get Alerts
Immediate alerts to your email and mobile phone.

Entry Price Levels
Entry price level for every signal Just choose one of our Top Brokers in the list above to get all this free.