Bulls may continue dominating S&P 500 market
S&P 500 Price Analysis – 07 February
The S&P 500 may breach the $4169 resistance level if buying pressure increases, and more buying pressure could push the price up to the $4276 and $4286 levels. If the $4169 resistance level is held, the price could reverse and fall in the direction of the support levels of $4087, $3929, and $3740.
Key levels:
Resistance levels: $4169, $4276, $4286
Support levels: $4087, $3929, $3740
S&P 500 Long-term trend: Bullish
S&P 500 is on a bullish movement on the daily chart. Buyers drove the cost to the ceiling of $4087 on December 13. The suggested level of resistance proved to be a barrier to the upward trend. At the level, a double-top chart pattern that discouraged buyers was visible. With the help of sellers’ pressure, the $3740 threshold was reached, but the price was unable to fall below it. The high of December was once again tested on January 27 and penetrated upside on 31 January. $4169 resistance level was tested last week.
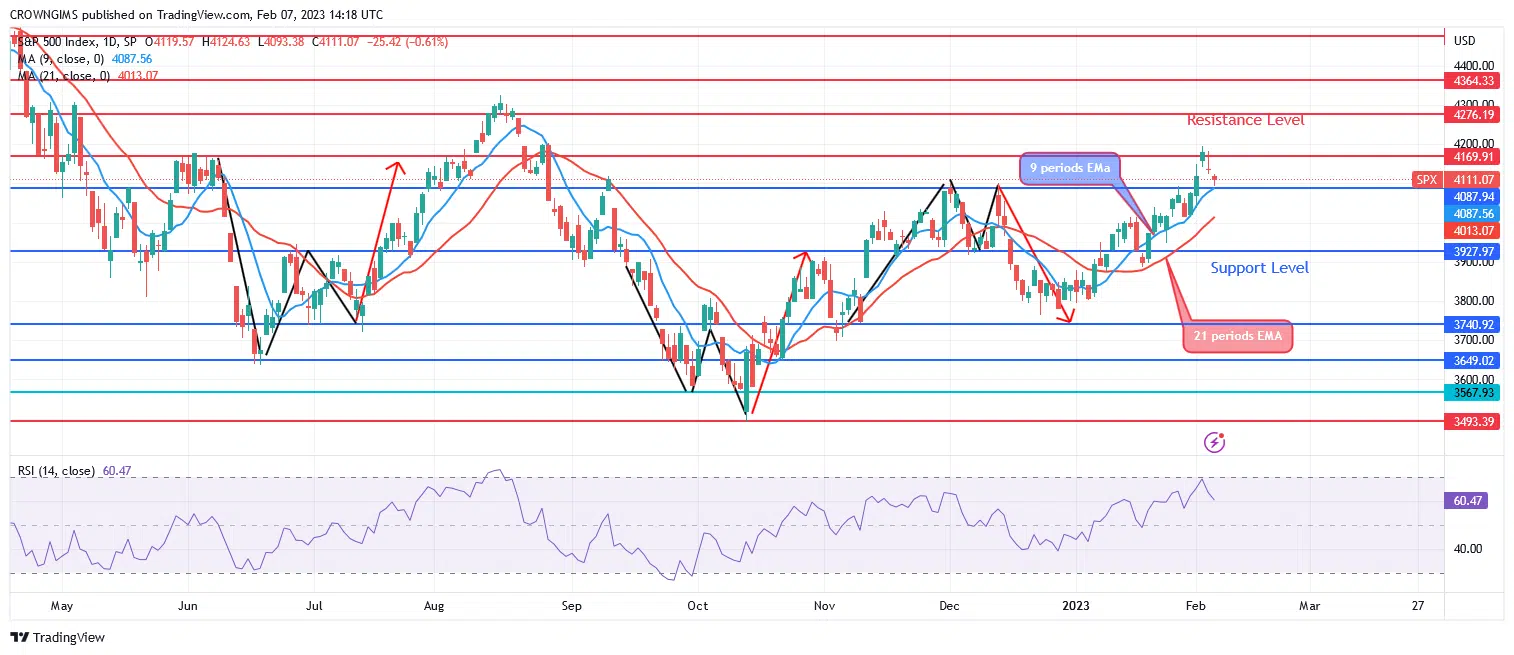
Indicating positive momentum, the S&P 500 is currently trading above both the 9-period and 21-period exponential moving averages. The S&P 500 may breach the $4169 resistance level if buying pressure increases, and more buying pressure could push the price up to the $4276 and $4286 levels. If the $4169 resistance level is held, the price could reverse and fall in the direction of the support levels of $4087, $3929, and $3740. A sell signal is indicated by the relative strength index period 14 being at 60 and the signal line pointing downward.
S&P 500 Medium-term Trend: Bullish
S&P 500 is bullish in the 4-hour time frame. The S&P 500 is expected to increase, according to the projection on the 4-hour chart. The sellers’ influence diminished as the price approached the $4169 resistance level. It resumed bullish trading after four hours. The price started to rise as the bulls gained momentum.
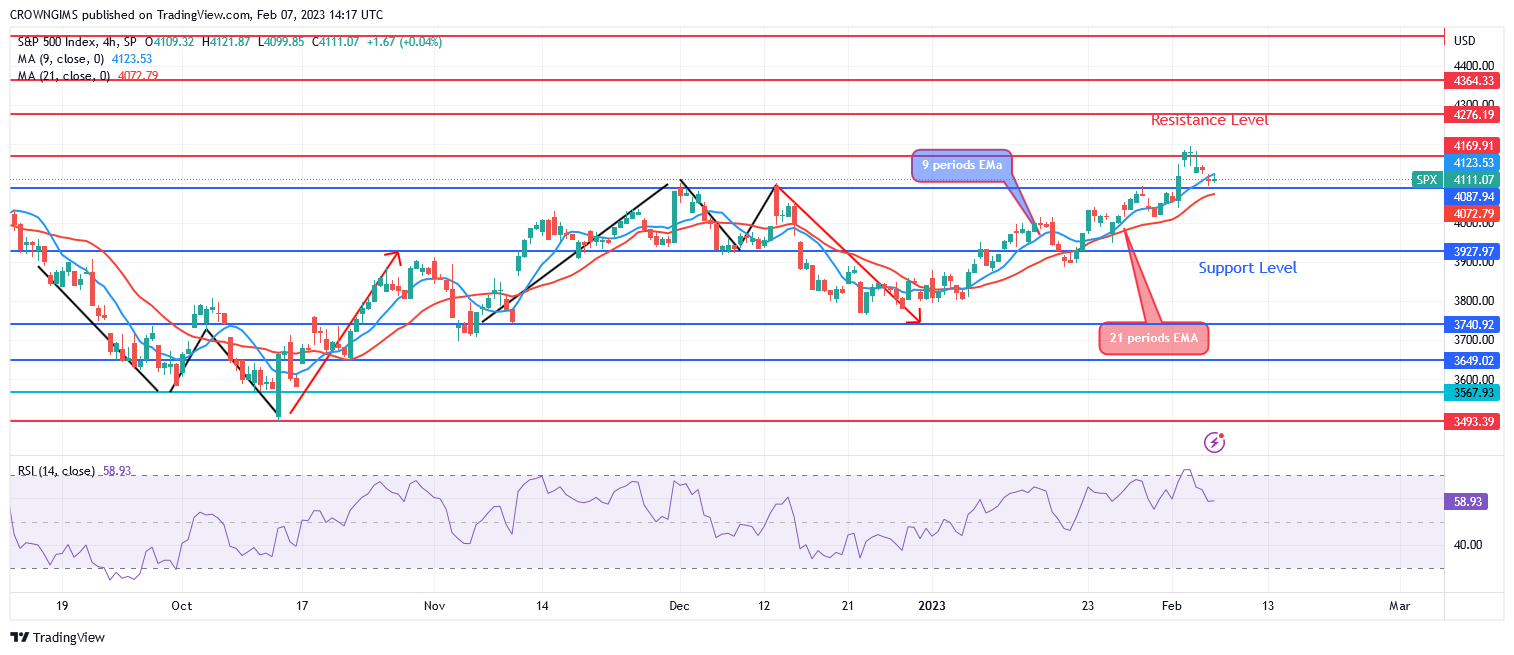
The $4169 resistance level was attained. Price is currently pulling back from mentioned resistance. The price of the S&P 500 is trading between the 9- periods EMA and 21-periods exponential moving averages. A bearish signal is visible on the Relative Strength Index period 14 at 58 levels.
You can purchase Lucky Block – Guide, Tips & Insights | Learn 2 Trade here. Buy LBLOCK
- Broker
- Min Deposit
- Score
- Visit Broker

- Award-winning Cryptocurrency trading platform
- $100 minimum deposit,
- FCA & Cysec regulated

- 20% welcome bonus of upto $10,000
- Minimum deposit $100
- Verify your account before the bonus is credited
- Fund Moneta Markets account with a minimum of $250
- Opt in using the form to claim your 50% deposit bonus
Learn to Trade
Never Miss A Trade Again

Signal Notification
Real-time signal notifications whenever a signal is opened, closes or Updated

Get Alerts
Immediate alerts to your email and mobile phone.

Entry Price Levels
Entry price level for every signal Just choose one of our Top Brokers in the list above to get all this free.